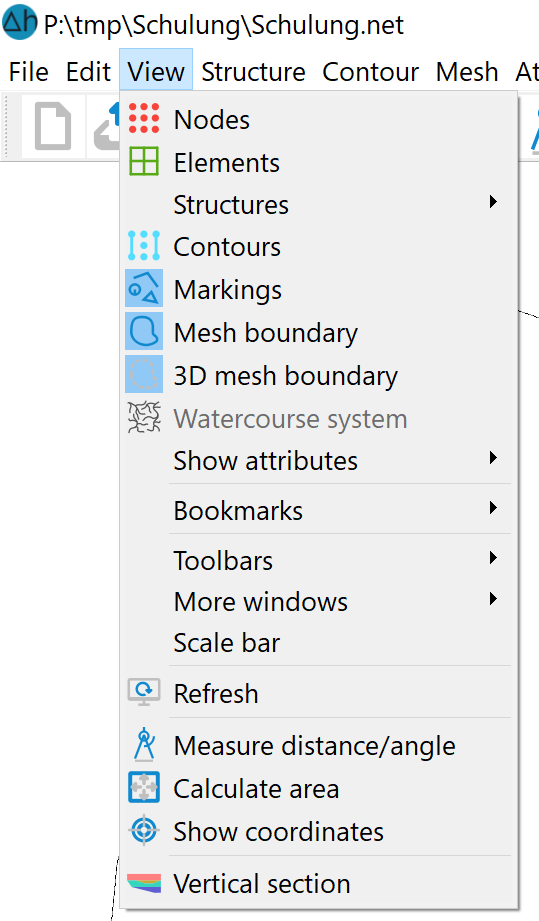
The "View" menu item contains different sub-items depending on the open file (model or plot file). The following menu items can be selected in model file mode:
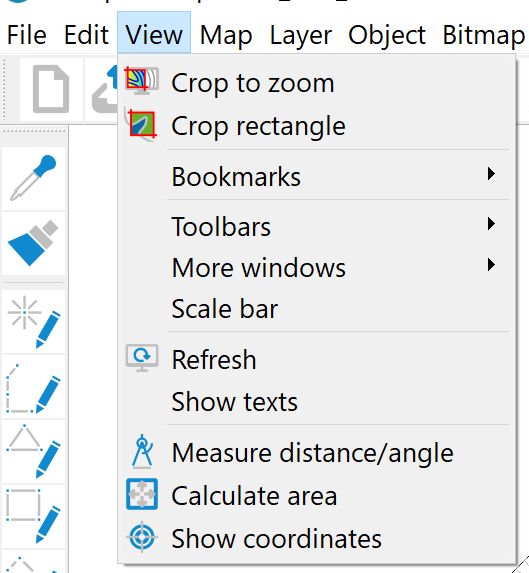
The following menu items are selectable in the plot mode:
The following is a description of the sub-items in model file mode:
Nodes/Elements
(model file only)
The nodes or elements can be shown or hidden here.
Structures
(model file only)
As this menu sub-item is very complex, it is dealt with in a separate sub-chapter.
Contours, Markings, Mesh boundary, 3D mesh boundary
(model file only)
If available, the contours, markers, the 2D mesh boundary or the 3D mesh boundary (3D model or 2D model with 3D sub-area) are shown or hidden after activating the respective menu item.
Watercourse system 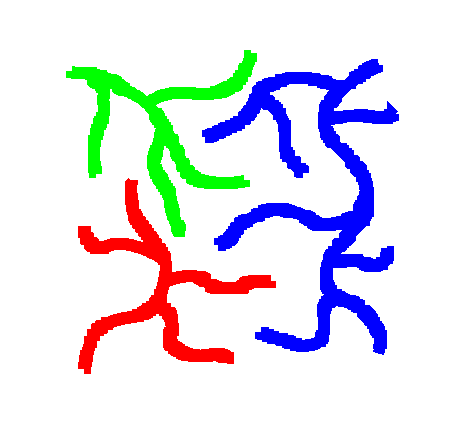
After selecting this function, the existing watercourse systems are displayed with their directional arrows.
The watercourse system attributes can be displayed via Show attributes.
Show attributes
(model file only)
As this menu sub-item is very complex, it is dealt with in a separate sub-chapter.
Bookmarks
(model - and plot file)
If you have zoomed into a project area that you would like to call up again later in the same way, you can create a bookmark. The following menu then appears under View  Bookmarks (not all entries are necessarily visible immediately:
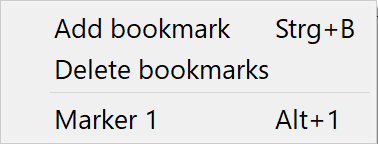
Selecting "Add bookmark" or the shortcut Ctrl-b saves the selected zoom area as a bookmark. The display area can then be changed as required.
If a zoom selection has been defined, further entries appear in the menu. The bookmark list can be reset via the menu item "Delete bookmarks".
If a zoom range has been added, an entry labelled "Marker" with consecutive numbering appears in the menu for each zoom range added. To return to a saved zoom range, either the corresponding menu entry "Marker no." or the shortcut Alt no. can be used, where no. refers to the assigned consecutive numbering.
Toolbars
(model - and plot file)
As this menu sub-item is very complex, it is dealt with in a separate sub-chapter.
More windows
(model - and plot file)
Additional windows containing information about the project can be opened here if requiredt.
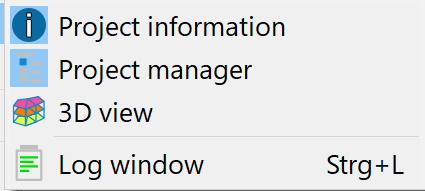
These are described in detail in the chapter "SPRING user interface".
Only the Project manager and the Log Window can be called upon in plot mode.
Scale bar
(model - and plot file)
After selecting this menu item, a scale bar appears at the bottom left of the main window. When zooming, the scale bar also adapts to the changed proportions.
Refresh
(model file only)
After selecting this menu item, the view in the main window is updated (all items are redrawn).
Measure distance/angle
(model - and plot file)
The Measure distance/angle menu item can be used to determine the distance between two points by drawing a virtual, straight line between two points. The distance and angle of the virtual line are displayed in the status bar in [m] and [degrees]. The virtual line drawn is temporary and is not transferred to the database.
The Measure distance/angle function remains active until the right mouse button is pressed or another function is activated.
Calculate area
(model - and plot file)
The Calculate area function determines the area of a selected object, which is only useful for linear or planar objects. For non-closed polylines, the polygon is closed by connecting the start and end points. The polygon must consist of at least three points.
The calculated area is shown in the status line in m² and km², whereby the programme assumes that one unit of the map coordinate system corresponds to one metre (e.g. Gauss-Krüger coordinates). If the coordinate unit differs from this, the area size must be converted accordingly. The area calculation can lead to problems if files have been imported that do not contain any scale information. In such cases, a scale of 1:10,000 is always assumed. The menu item Map Edit Scale ... (plot file only) allows subsequent correction of the Scale figures.
The Calculate area function remains active until the right mouse button is pressed or another function is activated.
Show coordinates
(model - and plot file)
The Show coordinates menu item displays the horizontal and vertical values of the current cursor position in the status bar. Pressing the right mouse button or activating another function cancels this function.
Vertical section
(model file only
By selecting this function, a straight line can be drawn between two points for which the Vertical section is displayed in a new window.
The following items are available only in the plot file mode.
Crop to zoom/crop rectangle
(plot file only)
With the help of these menu items, the loaded graphic can be "clipped" to the current domain defined by the zoom. This means that all objects that lie outside the selected domain are deleted and objects that lie partially outside the domain are clipped. If several plot files are to be clipped to the same domain, the first file is read in and the zoom range is defined. Once the graphic has been clipped and then saved, the next graphic is read in as a new file. Provided that the coordinate system is identical to that of the first map on which the graphic is based, this is automatically located in the same zoom domain and can therefore be clipped immediately.
Note: TIFF cards that lie completely or partially within the domain remain complete. TIFF maps can only be clipped with the menu item Bitmap Crop. Text objects are not reduced in size or clipped, but remain completely intact if their base point (bottom left) lies within the domain.
Caution: When clipping an area, it is not the visible area that is "clipped" but the domain specified by the last zoom. The visible area is usually larger than the zoomed area, as the aspect ratio usually does not correspond exactly to the display area. In contrast, the visible area is "clipped" when the view is clipped.
Show texts
(plot file only)
The existing text fields are shown or hidden by activating the Show texts menu item in the plot mode view options. By activating the Show texts menu item, the text box of all texts in the plot file is displayed. The shown text box approximates the size with which the texts will appear in the print.
Stand: 06.03.2026 | 