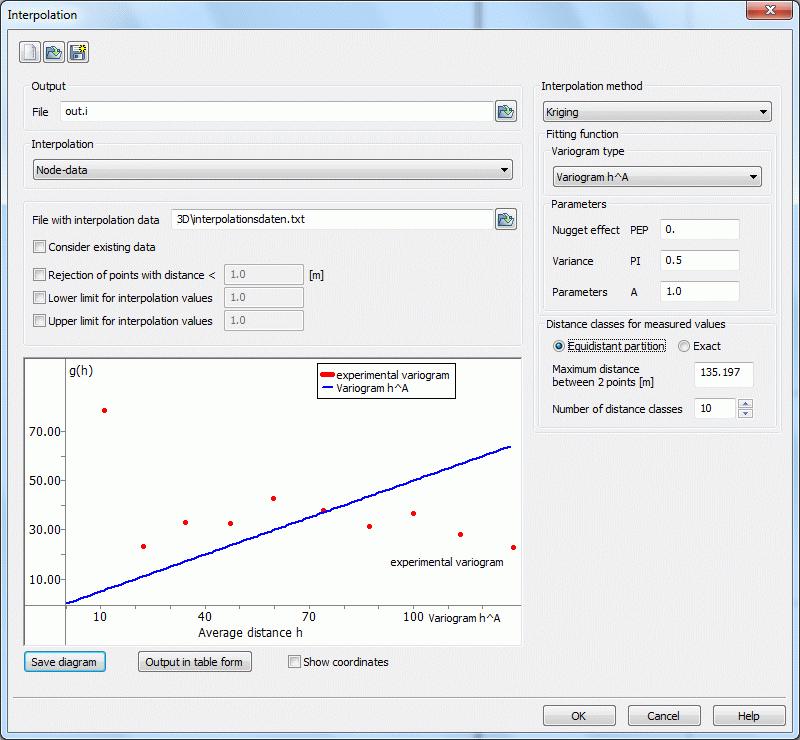
When calling up interpolation by Kriging, the file selection window appears first, in which the file with the variogram data is selected, unless a file with the interpolation data has already been selected. This file must be in structured data format (ASCII). The following input window then appears:

A type can be selected here from the 6 possible variogram types. The approach functions of the variogram types are described earlier in this section.
Depending on the selected variogram type, further parameters may need to be entered:
For variogram types (1) to (5), the parameters PEP, PI and A must be defined accordingly. The meaning of these parameters is described in the section above.
For variogram type (6), the degree of the balancing polynomial and the number of points in the experimental variogram for which the polynomial is to be optimised must be specified.
To create the experimental variogram, the number of distance classes and the categorisation of the classes must be defined. If an Equidistant partition is selected (default setting), the number and the maximum distance for the class division must also be specified. By activating the radio button Exact an explicit selection of the limits for each distance class (in a submenu) is possible.
If an Equidistant partition distance is defined, the corresponding distances in metres appear in the submenu when Exact is activated, which can then be edited further. If an Exact division is defined, the distance of the last distance class appears as the maximum distance when Equidistant partition is subsequently activated and the number of distance classes is preset accordingly.
The variogram based on the interpolation data appears on the left-hand side of the input window.
The change in the individual parameters can be read directly here so that the appropriate equalisation function can be created interactively.
The variogram can be saved as an image file (*.bmp, *.jpg, *.png) using "Save diagram" and as a table using "Tabular output". The "Determine coordinates" checkbox can be used to pick up the coordinates using the mouse pointer in the variogram window.
Remark:
The Kriging algorithm is not particularly suitable for a large number of inteprolation values. The computational and storage effort required to create the variogram increases quadratically with the number of interpolation values. For the actual interpolation, the computational effort required to calculate the LU decomposition of the weighting matrix is already proportional to n³. Each time a variogram is created, various arithmetic operations must be carried out for all pairs of interpolation points. Therefore, the creation of a single variogram can take a long time even without actual kriging interpolation.
 Interpolation of Groundwater Contour Maps
