If a measurement data file is available, the differences between the measured and calculated groundwater levels can be displayed as "Differences as circles" at the measurement points (usually groundwater measurement points).
This is done as part of the plot display by selecting "Measured data" for the source. Click on the open file button next to the File textbox, an input window appears in which the file with the measured values can be defined:
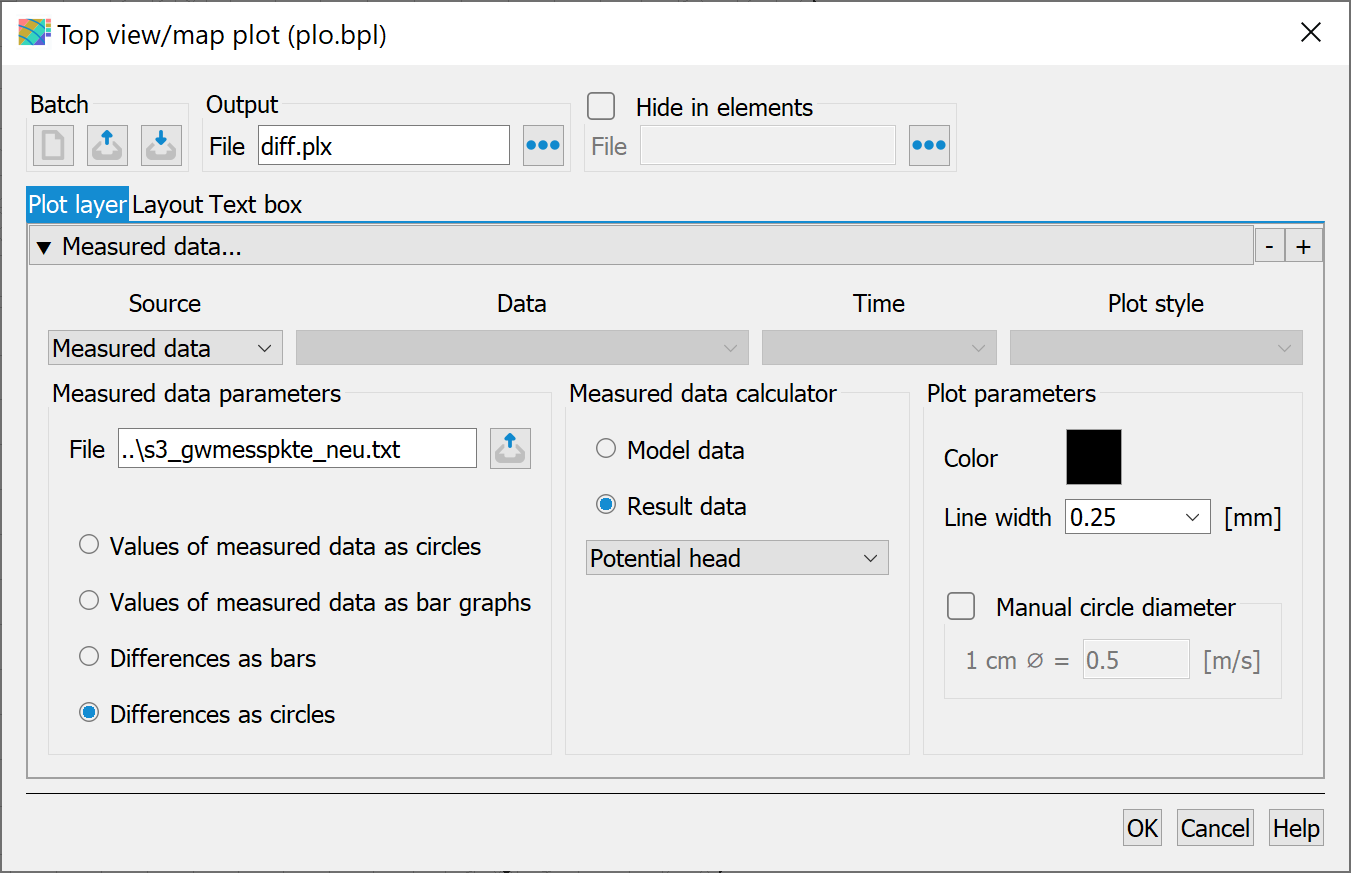
Creating a difference plot
The file with the measurement data has already been used previously in Step 3: Data assignment with the interpolation of external data. Differences are selected as circles in the input window and the following image is created:
Isolines with difference plot
The calculated potential heads, particularly in the eastern part of the model domain, match the measurement data quite well. The deviation at the measuring points is a maximum of 0.47 m, with an average of 0.10 m. These error statistics are shown in the log window after the plot is created, the deviations in the log window of the plot creation refer to all nodes and are max. 1.24 m, on average 0.11 m:
The calculated differences are shown at each measuring point. Positive values (black) mean: the model calculation provides larger values than the measurement, which in this example means that there is too much water in the model at those points. With negative values (red) the calculation produces smaller values than the measurement, which means that there is too little water in the model at those points.
Note: If the calculated differences are to be saved as a file for later evaluation, this is possible under File  Export Difference to measurement data:
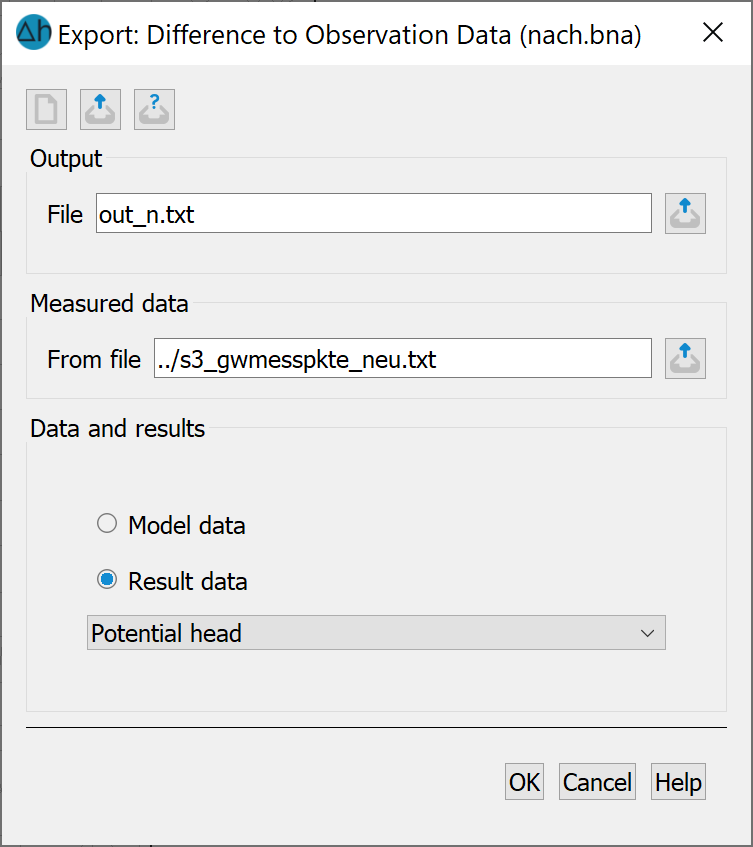
Export of measurement data differences
The next step is Calibration of the example in 3 steps
Stand: 06.05.2025 | 