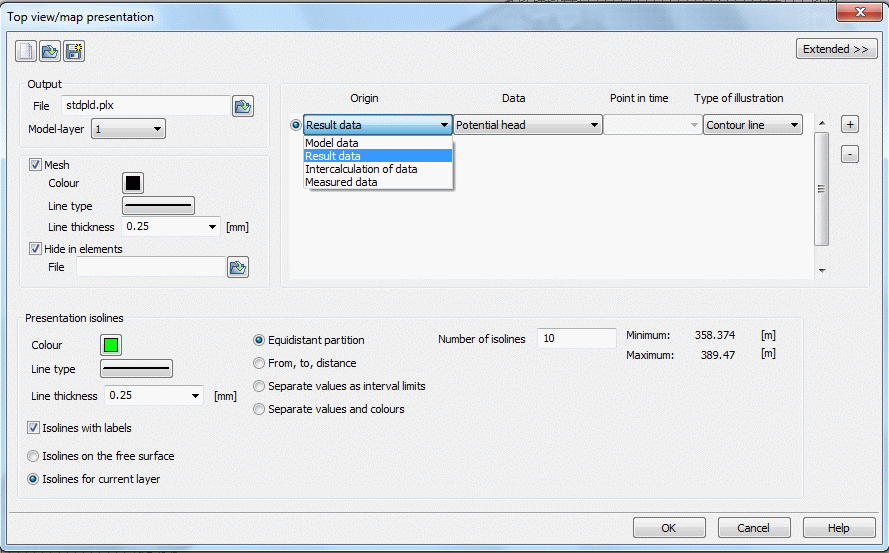
After selecting this menu item the following input window appears:
The buttons at the top of the input window allow resetting the input parameters ( ), opening an existing batch file (
 ) or saving the current batch file under another name (
 ).
).
Output
(batch command DATE)
The output file name is specified. Using the file selection window the name of an existing *.plx file can be loaded.
In a 3D model, the layer can be selected for which a top view should be created (horizontal section).
Mesh
(batch command NETZ)
By checking the box Mesh, the element mesh is shown in the plot. The colour, the line type and the line width can be selected.
Hide elements
In some models it may be useful not to present the results (eg, arrows or speed isolines of the potential) in certain areas, i.e. in a 3D model is the selected layer unsaturated or the layer is an aquitard. By specifying the appropriate element numbers in a separate ASCII file (Ausblend) the area to be hided is defined. The format of this file is equivalent to the input format of the model file (16x, 9 (I6, A1), A1) beginning in the first line without data identifier or comment line. The data value is arbitrary or may be absent (batch command AUSB ).
Origin, data type, point in time, type of illustration
In this area of the input window, the individual layers of the plot are selected.
The order of the selection is not relevant. Before the plot file (*.plx) is created, the layers are sorted, so that surface representations are behind point or linear representations.
Represent several types of data simultaneously
The buttons at the right of the illustration type

allow to add another layer (+ button) or remove a layer from the list (- button). In this case the active data is removed from the list. The radio button at the top of the line indicates which record is active.
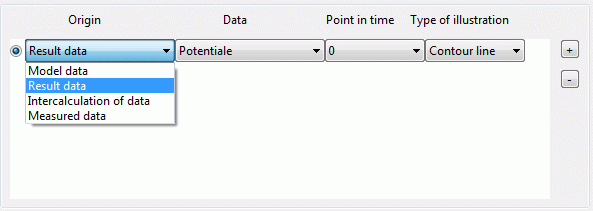
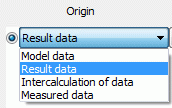
In the column origin is the following data selection available:
Depending on the selection in this field there are more input options for the other columns (data, point in time, type of illustration).
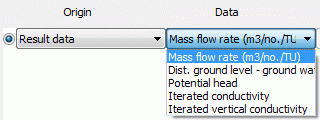
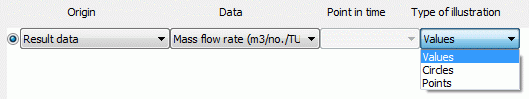
Origin: Model or result data
By selecting the model or result data as origin the data types stored in the background files are provided in the column data.
The types of model data result from the attributes existing in the model file, the types of result data result from the previously performed calculations.
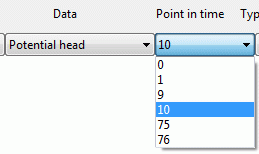
After a steady state flow calculation this outcome of data is available:
In a transient calculation the date is additionally set for an illustration.
The selection of the data type results in appropriate display options.
For element data the following data illustration types are available:
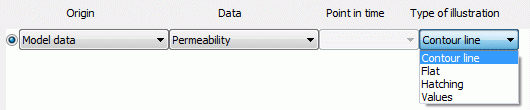
The illustration type Hatching is only possible for element data.
For node data, which are often defined globally, the following data illustration types are available:
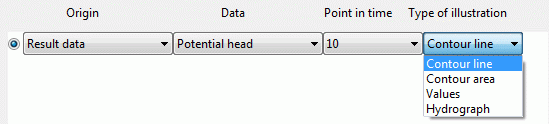
The illustration type Hydrograph is only possible after a transient calculation.
In contrast, for data at certain points such as sources/sinks or fixed potential heads are offered only the following illustrations:
For specific data such as element-/ node numbers, mesh boundary, velocities or markings only the illustration type line is offered. It can be modified in the input block Presentation.
Details are described in chapter: "Types of illustration“ .
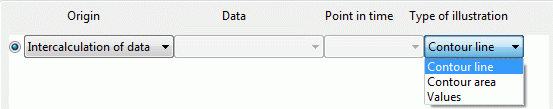
Origin: Intercalculation of data
Here it is possible, to offset data from the same or other simulation runs or from other layers against one another, and then to present the result (batch command RECH).
Additionally to the input block Presentation appear the following input possibilities:
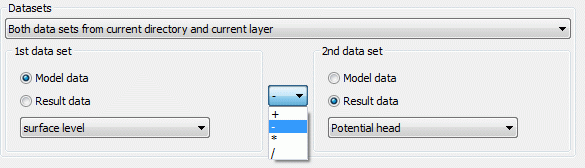
First thing is to decide on which data base the data are to be charged. The following combinations are possible:
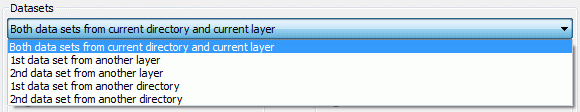

Both datasets are found in the current directory, i.e. they result from the same calculation, and (in case of a 3D horizontal section) they both refer to the current layer.
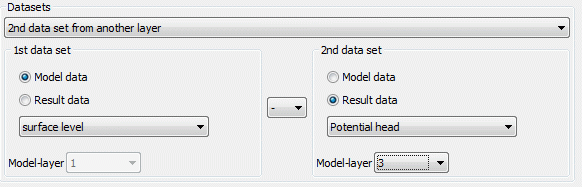
Both datasets are found in the current directory, i.e. they result from the same calculation, but one of the datasets (in case of a 3D horizontal section) can refer to another layer.
Both datasets (in case of a 3D horizontal section) can refer to the current layer, but one of the datasets is found in another directory, i.e. results from another calculation.
Using a dataset from another directory, you must define the path from the current to the other directory in the corresponding text box (the directory selection can also be done in a file selection box).
Using a dataset from another layer (3D horizontal section), you must define the layer number in the corresponding text box.
Selecting Intercalculation of data the fields data and point in time cannot be edited. This necessary information is specified in the input data block datasets for both species.
The left part of the shown dialog box defines the first data set, the right part defines the second one for the intercalculation. First, you must decide whether to use model data, results or transient results. Then you can select the appropriate data type. In case of a 3D model, all data refer to the layer which was defined in the input block Output, except when data is offset against data from another layer.
Available are the four fundamentals operations of arithmetic +, -, * and /.
Possible illustration types are: contour line, flat or values.
The illustration parameters are defined in the input block Presentation.
Origin: measured data
If measured data should be presented additionally to the input block Presentation appear the following input options: (batch command EICH):
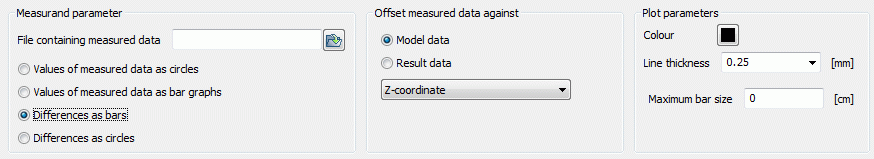
At first, the file with measured data has to be entered or selected in a file selection box. The file must be formatted in the structure file format .
The following possibilities are available:
The values of the dataset are represented as circles:
The relevant nodes are marked by a + or another marker (see plogeo.ini commands EHGT and ETYP ). The corresponding value is printed at each node.
The values of the dataset are represented as bars:
The values of the measured data can be represented as bars. Among the colour and the line width the maximum size of the bar is defined:
The difference between the current data and any kind of existing data (input or result) is represented:
The differences are represented as bars (see figure above). The colour and the maximum bar size are determined by the user using the plogeo.ini command RADI .
The differences are represented as circles:
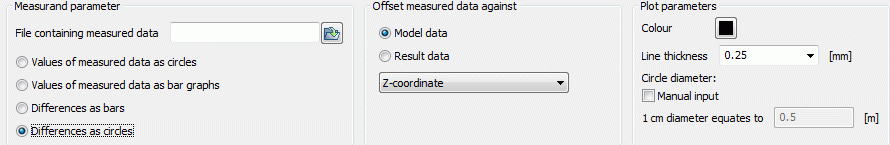
Without activating the checkbox „manual input“ the maximum circle size is defined in the plogeo.ini-file (Edit  Options). In the batch file of the plot generation the following appears for EICH:
EICH ## Measured data differences as circles
201 0 0 0 # Potentials
1 0.25 0 0 # Colour, line width, circle plot
gwmesspkte.txt # file with measured data (structure file format)
If the manual input is activated, the user defines that a difference of e.g. 0.5 m/s corresponds to a circle radius of 1 cm. In the batch file of the plot generation the following appears for EICH:
EICH ## Measured data differences as circles
201 0 0 0 1 0.5 # Potentials
1 0.25 0 0 # Colour, line width, circle plot
gwmesspkte.txt # file with measured data (structure file format)
The values plotted at the measuring nodes are not plotted as real text but as poly lines. The default font-size for numbers is 0.18 cm. It can be changed using the menu Edit Options Plot option Size (plogeo.ini command HWER ).
During the offset of the data against other data an ASCII file DiffEich.txt is automatically created in which the x and y coordinates, the difference, the measured value and the calculated value in the format (6X, F10.2, F10.2 , F10.3, F10.3, F10.3) are saved. This file can be used to create a scatter plot (measured/calculated values as x/y graph) with Excel.