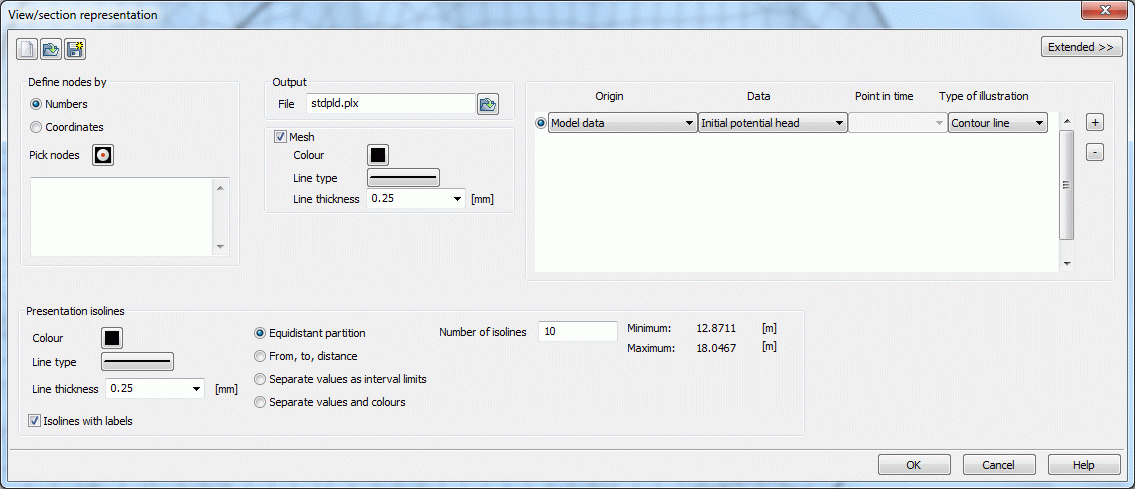
By selecting this menu item a vertical section can be created. The following input window appears:

If data should be displayed in a vertical section, first the position of the section must be defined (batch command VERT ).
Two possibilities are available:

Numbers
The position of the section is defined by node numbers. These can be selected interactively in the SPRING-surface (Pick nodes  ).
).

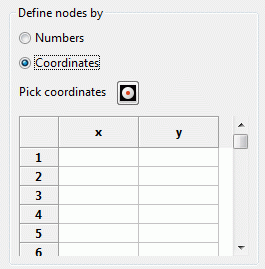
Coordinates
The position of the section is defined in x- and y-coordinates. The coordinate pairs can be entered directly in the appearing table or selected interactively in the SPRING-surface.

Remark:
If coordinates are used instead of node numbers SPRING looks for the nodes which are nearest to the selected coordinates. So the vertical section is placed through these nodes and NOT through the coordinates!
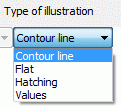
Furthermore, the input blocks correspond essentially to those described in the chapter “top view/map representation”. There are minor restrictions on the various display modes observed. Thus, in node data, only the following illustration types:

For element data, the illustration types are limited to these options:

The illustration of measurement data is in a vertical section not possible:

After creating a vertical section (name.plx) a structure file (name.str) is automatically created that contains the coordinates of the track. By importing the file or overlaying the structure in a top view the track of the vertical section can be marked.

 Types of illustration