Node data that is not defined as area-wide/comprehensive can be displayed as circles.
The values at the nodes or element centres are displayed with numbers from polylines. The height of the digits is preset to 0.18 cm in the menu Edit  Options Plot option Size (plogeo.ini command HWER ).
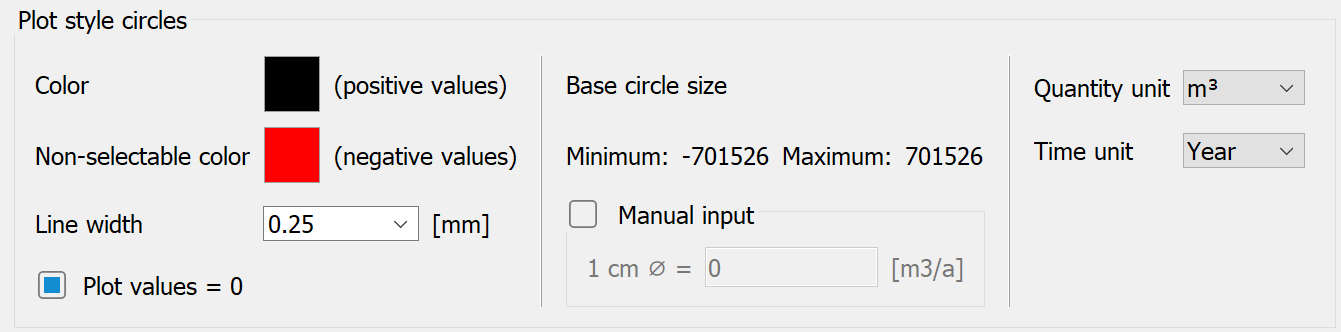
In the input block, a colour can be selected for positive values and the line width can be specified. The colour for the negative values cannot be selected by the user. This is defined internally in the programme. The display of the colour for the negative values is to be understood as a preview of the result.
In the circular representation, the circle scaling can be defined manually by entering a scaling value for the circle size of 1.0 cm. In this way, for example, representations of mass flow rates in different horizontal layers of a 3D model remain comparable.
If the circle scaling is not defined manually, SPRING calculates a maximum circle size for the largest value in the current plot. Alternatively, this maximum circle size can be defined in the menu Edit Options Plot options Sizes (plogeo.ini command RADI).
When displaying rate data, the unit m3/?/TU (TU = time unit of the mesh file), the conversion of data in other quantity and time units is also offered.
By ticking the Plot values = 0 box, these values are explicitly displayed, otherwise values equal to zero are ignored and not plotted.
Stand: 02.06.2025 | 