Classification with single values and colours
The input block looks like this:
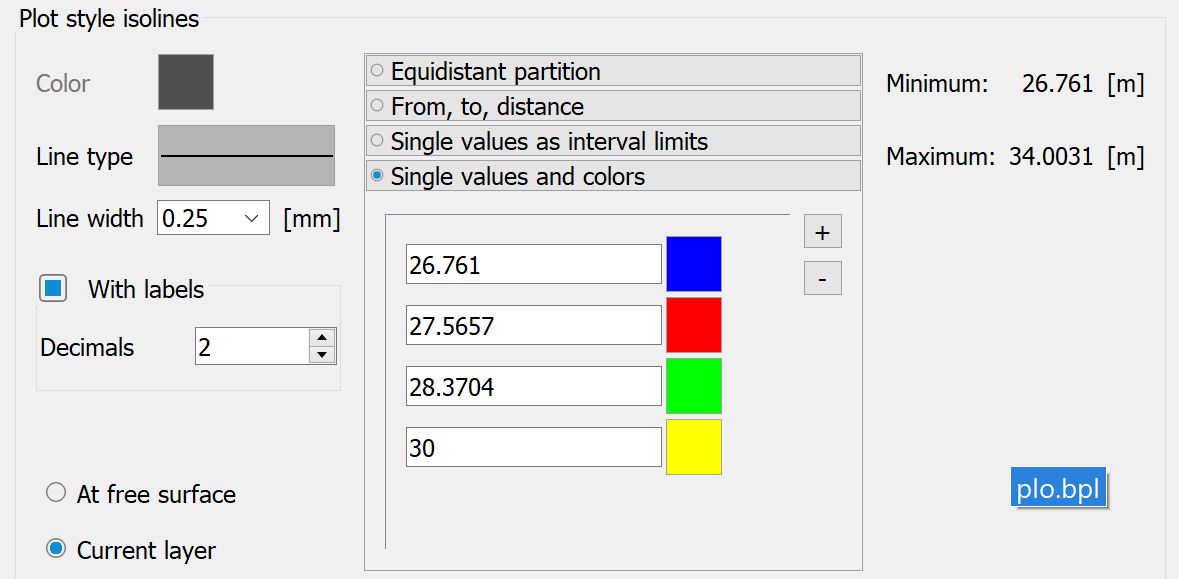
When plotting with individual values and colours, the desired isoline values are entered with the corresponding colours in a separate window. The colour selection in the left-hand part of the input area is deactivated and is not taken into account when plotting.
The plus button can be used to add an interval, while the minus button can be used to delete the last interval.
 Special features
Stand: 02.06.2025 | 