Limit display of isolines only to the saturated zone
Isolines can be hidden above the saturated zone in a vertical section or vertical model.

Potential lines in a 3D model
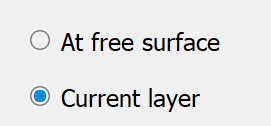
When visualising potential isolines in a 3D model, it is not necessarily known for which horizontal section plane the potential heads lie in the saturated zone.
Regardless of the set section plane, the potential heads can be displayed in a horizontal section through a 3D model at the free surface (1st from the top, if there are several)!.
Visualisation with a digital elevation model
If a digital elevation model (DTM) is available for the model, the terrain surface (model data) and the depth to the water table (result data) can be plotted on the basis of this DTM when displaying contour lines or areas. To do this, the DEM must be available in structure data format (ASCII).
In the terrain height plot, the DTM is displayed instead of the GELA data type. For the visualisation of the depth to water table, these are determined by offsetting the DTM against the calculated potential heads. In both cases, an auxiliary mesh is automatically created on the basis of the DTM and the model nodes, so that the creation of such a plot may take some time depending on the size of the data sets and the available computing capacity):
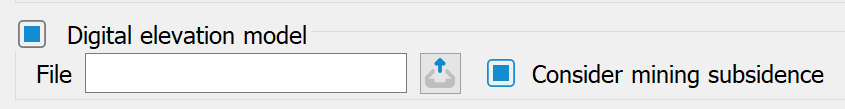
If the model file contains subsidence data (attribute BERG), it is possible to lower the digital elevation model using the subsidence data from the model.
The following model example illustrates the benefits of calculating the depth to the water table on the basis of the DHM:
The watercourse shown (attributes VORF and LERA) is a watercourse whose bed is to be raised as part of a watercourse reorganisation (e.g. renaturation). As a result, a rise in groundwater is to be expected in the area of influence of the course of the stream. To provide evidence, an assessment of the groundwater level situation is therefore carried out for the current initial state (= the one depicted in the model). Developed areas are considered critical if they already have, for example, a groundwater level of less than 1.5 metres in the initial state.
To illustrate the greater accuracy that can be achieved by calculating the depth to the water table with the DEM, the water table depth plot was created after the flow calculation without and with the use of the digital elevation model.
Result of the water table depth calculation without intersection with the DHM (26 buildings are affected)
Result of the water table depth calculation with intersection with the DHM (13 buildings are affected)
Based on the digital elevation model, only half of the buildings are classified as critical.
The enormous difference in accuracy results from the much higher grid density of the DTM (here: 5 x 5 m grid) compared to the density of the FE mesh nodes, whose approximate spacing in this model is around 30-50 m.
Comparison of the density of the grid nodes (blue) with the density of the DHM grid nodes (red)
 Filled area
Stand: 02.06.2025 | 