(Archive fl1.zip)
Natural flooding means that the pit's drainage systems are switched off and the pit fills with water due to the natural inflow of groundwater until the natural groundwater level is reached.
For the simulation, it is necessary to define the model nodes of the pit and to describe the relationship between the pit water level and the water volume within the pit ("stage-volume relationship").
The pit nodes are defined using the GRUB attribute. This boundary condition is assigned to node layers 6 and 7 using the existing structure.
The GRUB attribute contains the zone number of the pit, in the example this is the number "1". The associated stage-volume relationship is defined in an ASCII file with the name "grube1.hv". (The file name is made up of the word "pit", the zone number (here: "1") and the ending *.hv, contained in the example archive "fl1.zip"). The following illustration shows the stage-volume relationship of the example. The gradient of the curve is also shown for a better understanding of the subsequent simulation steps.
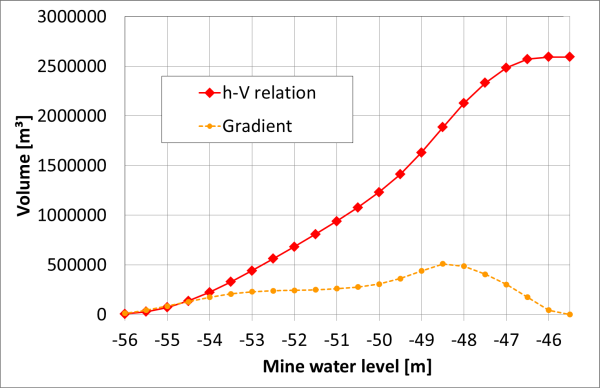
Relationship between the water level and the water volume in the pit
For transient flow calculations in SPRING, an transient input file is required which contains the corresponding transient boundary conditions.
As the transient boundary conditions are not changed in this example, the transient input file only consists of the following lines (see file "trans.txt" in "fl1.zip").
Transient input file (simulation 1):
# SPRING tutorial
# Flooding
# Simulation 1
ZEITEINHEIT MENG JAHR
BEZUGSDATUM 01.01.2012
DATUM
02.01.2012
Before starting the transient calculation, all nodes must be assigned initial potential heads (attribute EICH). To do this, the potential heads determined in the steady state calculation (from directory fl0) are imported to the identifier EICH with Attributes  Import model data/result data...:
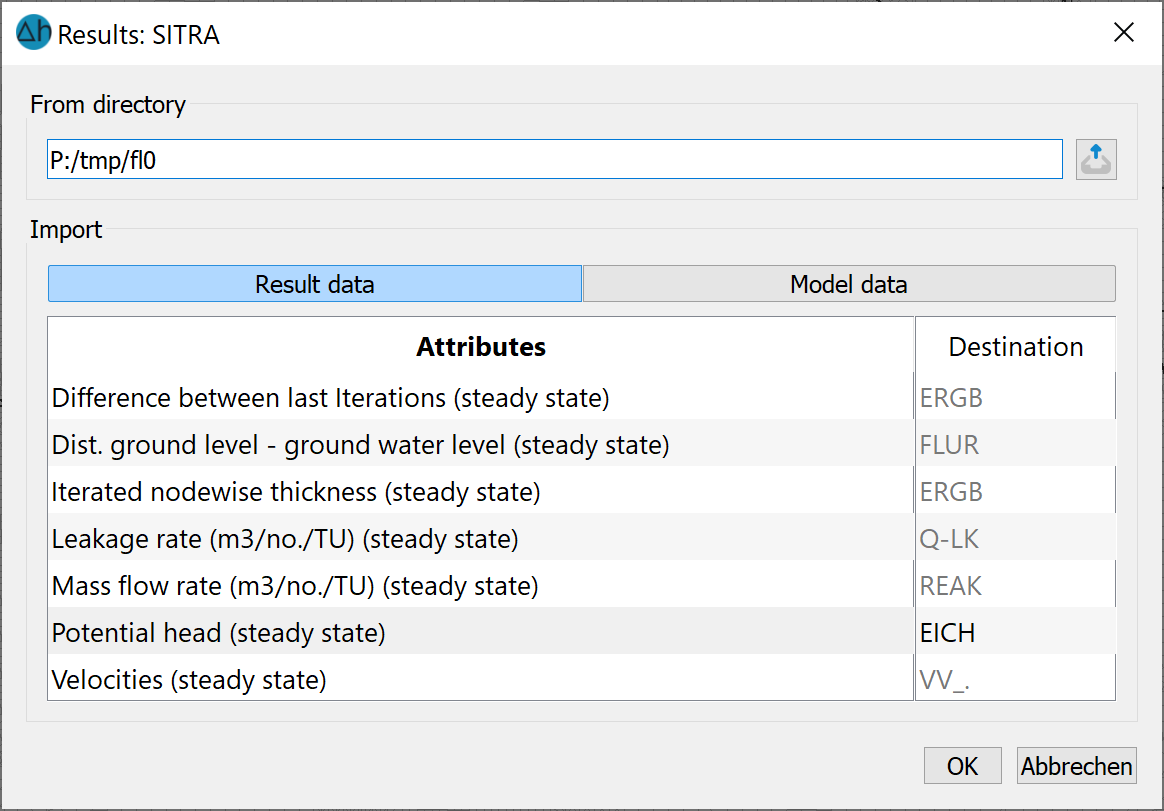
Definition of initial potential heads
After saving the model file and performing the model check (step 1) (Calculation Model checking...), the transient calculation (step 2) is now started with Calculation Transient flow...:
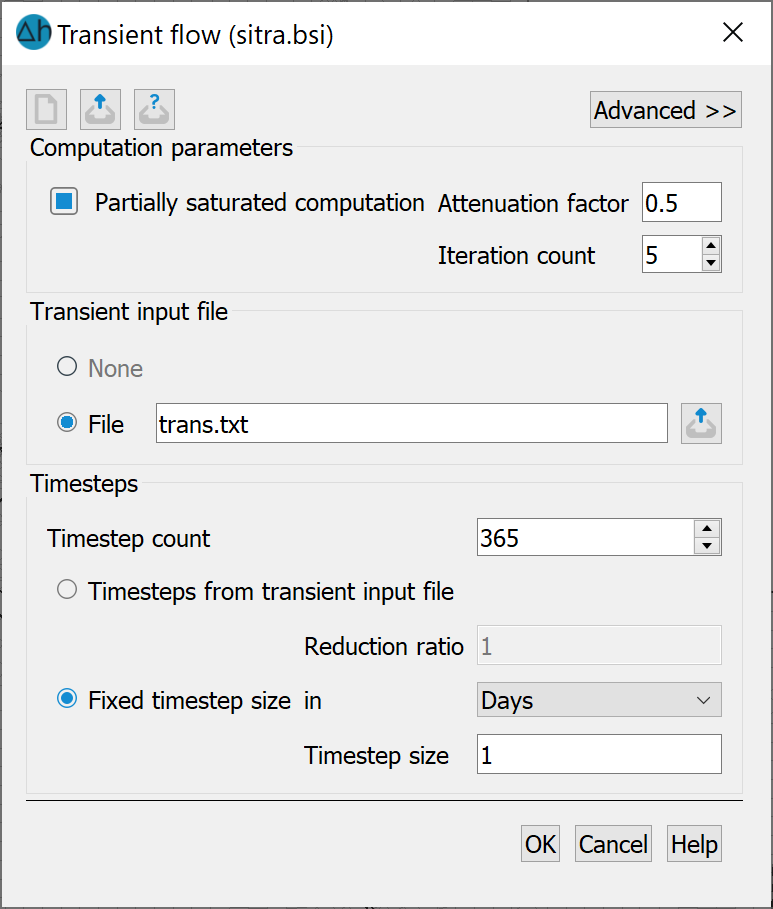
Transient flow parameters (step 2)
For the advanced flow parameters, the initial condition must be set to the initial potential heads with "EICH".
The vertical section shows the resulting potential heads and can be created using the plot batch file "cs.bpl". The horizontal section shows the potential heads in the 56th time step in layer 7 and can be created using the plot batch file "pot56-7.bpl". The horizontal section also shows hydrographs of certain nodes in the pit floor. The kink in the curves indicates the end of the flooding process when the pit is completely filled with water. The potential heads then increase until steady state conditions are reached.
Vertical (left) and horizontal section through layer 7 (right) with results after 56 days of flooding (flooding 1)
In addition to the usual results files, a file called "gruben.csv" is also generated when simulating mine flooding. This file contains a table with all the results of the mine flooding for each time step and thus enables them to be analysed graphically. In this example, the evaluation was carried out using MS Excel (file "gruben1.xls" in "fl1.zip") and shown in the following figures.
The first figure shows the resulting pit water level and the proportions of the individual boundary conditions in the mass balance. Depending on their current vertical position, the pit nodes are set to either the "seepage" or "fixed potential head" boundary condition at each time step:
“Seepage”: The vertical position of the node (z-coordinate) is above the current mine water level (unsaturated).
“Fixed Potential head”: The vertical position of the node (z-coordinate) is below the current mine water level (saturated).
Both boundary conditions cause a mass flow that leads to an exchange between the aquifer and the pit. In the current example, the sum of the mass flow of the two boundary conditions corresponds to the groundwater inflow (see diagram).
The kink in the mass flow curves is caused by the change in the gradient in the stage-volume relationship. The pit is filled after 124 days.
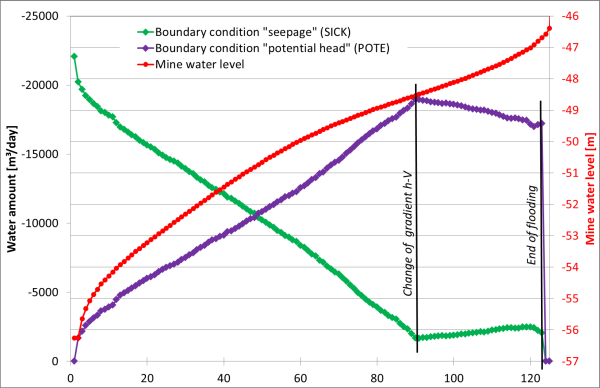
Water level and water volume up to the end of flooding (flooding 1)
|
|
|
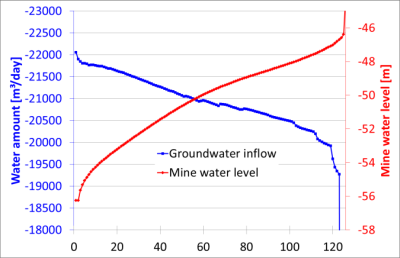
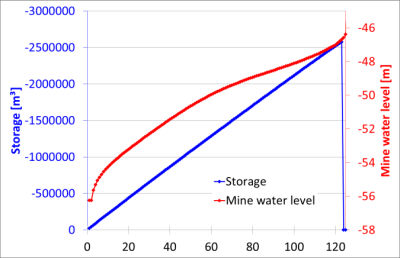
Groundwater inflow (left) and storage (right) until the end of flooding (Flooding 1)
Simulation 2: Controlled flooding
Stand: 18.04.2025 | 