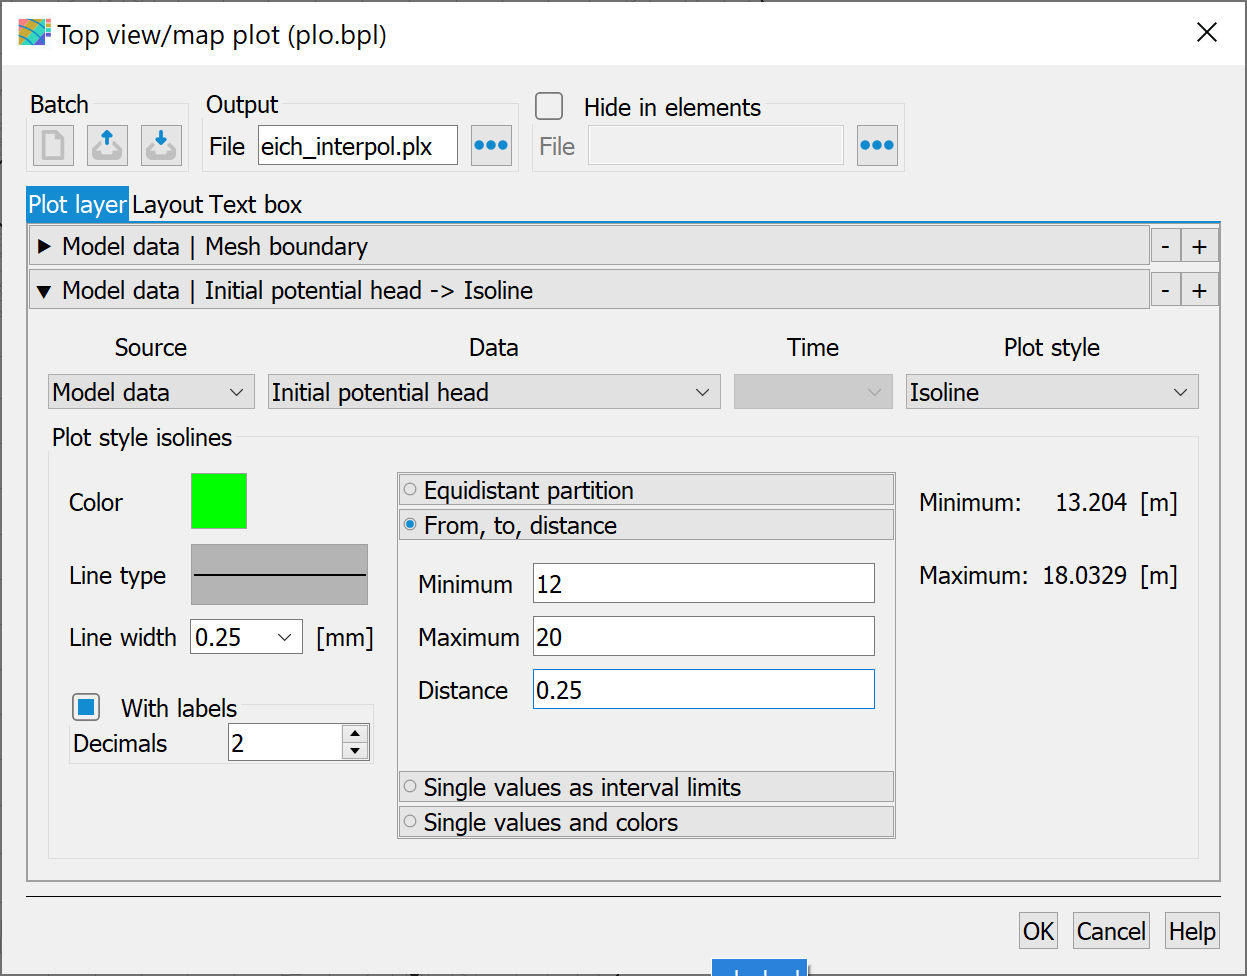
After the model check, plots of the model data can already be created. The EICH potential heads can be displayed in an isoline plan to visualise the current model status. With File  Create plot Top view/Map presentation... the following input window appears:
Plotter position
After selecting the data type Model data Initial potential heads Isoline, select the display From, to, distance option and assign respective values of: 12.0, 20.0, and 0.25 m. For the plot the colour green is selected. Then enter a name for the plot ("eich_int_pol.plx", do not use spaces in the file name) and start the plot creation by clicking OK. With File Import Overlay file...: *.plx the plot can be displayed. The following image appears:
Isolines of the interpolated calibration potential heads
The next step is Calibration with the gradient method
Stand: 06.05.2025 | 