Mesh – Data
The setting options shown in the following input window are available for displaying data:
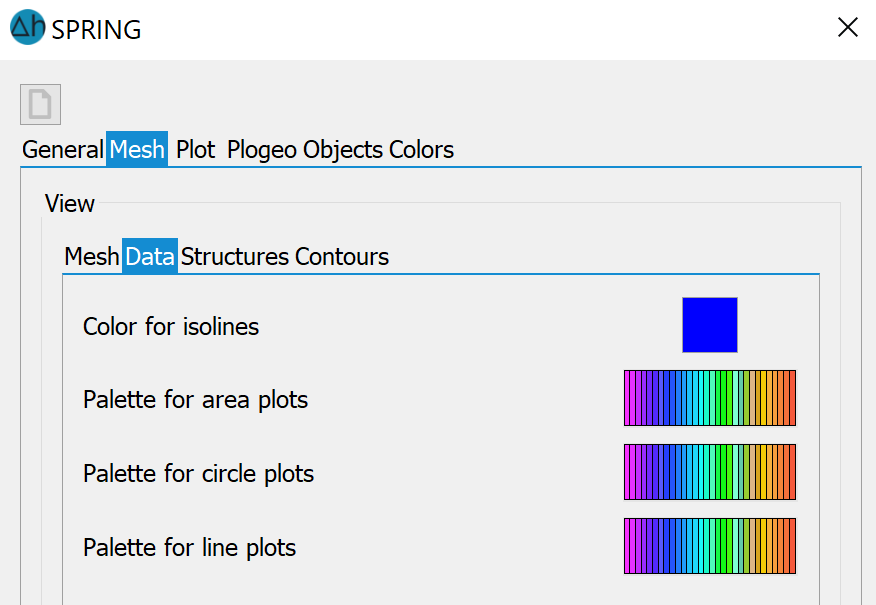
Colour for isolines (variable XSUSIIsolPen)
Colour palette for area plots (variable XSUSIFlaePen)
Colour palette for circle plots (variable XSUSIKreiPen)
Colour palette for line plots (variable XSUSILinePen)
The colour or palette set with these options is used as the default setting when displaying the data as isolines or area, circle or line plots (menu: View  Show attributes…).
Stand: 06.03.2026 | 