After selecting the structure via
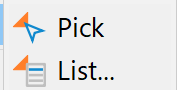
Depending on the structure type, one of the following input windows appears (In order to pick/select a structure, it must currently be displayed in the main window):
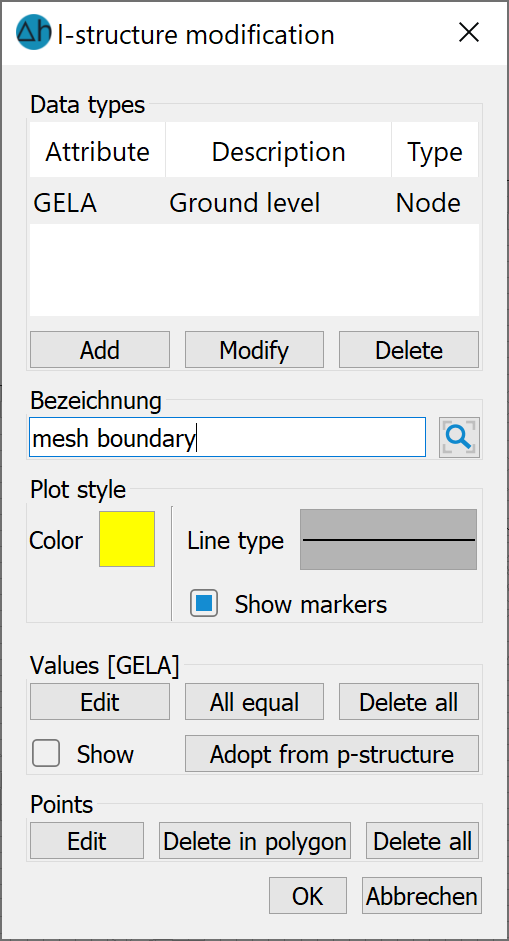
The Data type, Info, Values and Points areas are the same for all structure types. Only the Plot style area depends on the selected structure type.
Data types and info area:
Selection of data types: This determines which attributes are assigned to this structure. If Add is selected, several attributes can be assigned to a structure (e.g. VORF and LEKN on a receiving water body). A selection window appears with the possible attributes.
If you select Modify, the attribute of the selected structure can be changed.
Delete removes the selected attribute from the list. The structure name appears in the Info area.
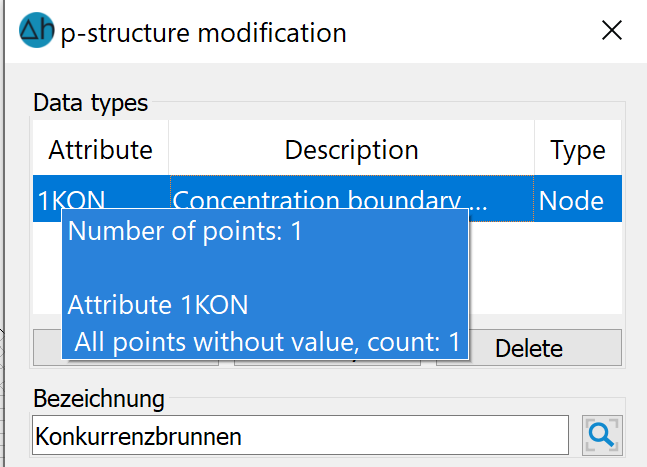
When the mouse pointer is moved over the data type window, the statistics of the active structure are displayed. This includes the minimum and maximum values, as well as the number of data points.
Representation, Values, Geometry:
The following input options are available for p-structures (points:
Plot style area:
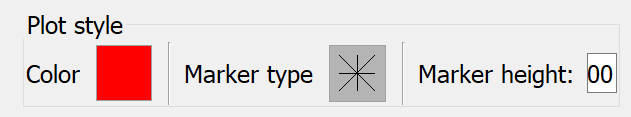
Here, the preset colour, marker type and marker height (in pixels) can be changed as required when the structure is displayed. This helps to differentiate between the individual structures in the graphical display.
Values area:
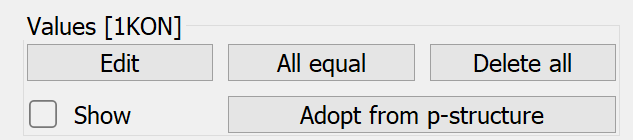
Edit: A table appears with the x and y coordinates and the assigned values of the individual structure points. A value can be assigned to each structure point here:
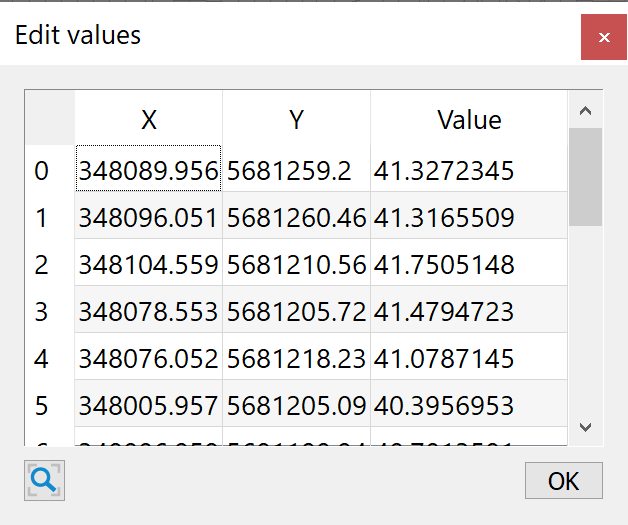
The values can be assigned individually, by multiple selections or globally by selecting the column:
Individual values are assigned by entering them in the "Values" column. If several structure points are to be assigned the same value, select one or more cells with the left mouse button and simultaneously press the "Shift" or "CTRL" keys. Then right-click to open the following context menu:
After selecting "Set value..." option, a dialogue window opens in which the value for the selected cells can be defined:
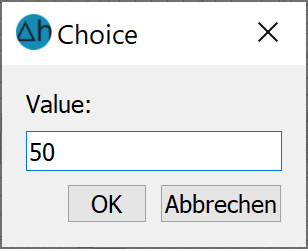
The values are assigned by confirming with "OK".
Delete all: All assigned values at the structure points are deleted.
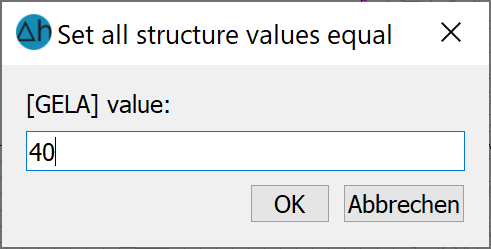
All equal: All structure points can be assigned a uniform value via the following dialogue:
Adopt from p-structure: This is used to transfer the values from a point structure to another point or line structure. A maximum coordinate distance (dx) and the ratio of the x and y distances of the node/element centre point (eps(x)/eps(y)) to the structure point must be defined in a dialogue.
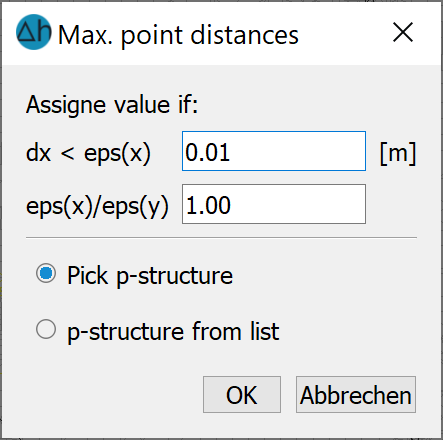
If a point of the selected point structure is close enough to a point of the structure to be processed according to this definition, it receives the value from the other point structure.
The desired p-structure can either be selected from the main window (picked, if the structures are displayed) or selected from a list.
Show: The values assigned to the structure are displayed on the screen.
Points area:
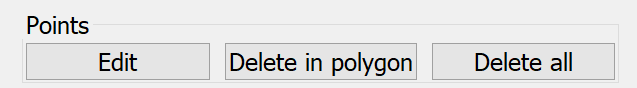
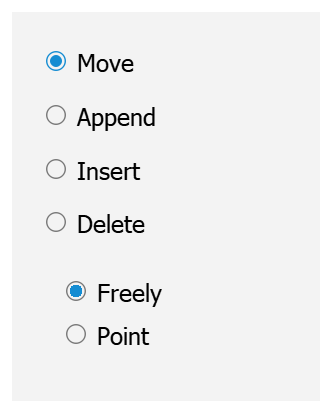
Edit: After selecting Edit, an interactive menu appears in the user interface in which the following actions can be selected:
Delete in polygon/Delete all: Structure points in an area or all the structure points can be deleted with this option. Individual points are deleted using the Edit button.
The changes to the structure only become effective when you confirm with the OK button!
The following Plot style options are available for l-structures (lines:
Presentation:
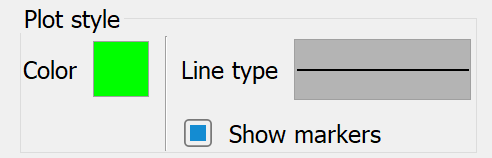
Here, the preset colour and line type can be changed as required when the structure is displayed. This helps to differentiate between the individual structures in the graphical display. Additionally, all points on the line structure are displayed by activating the Show marker checkbox, so that the individual sections of the structure line can be recognised.
The following display options are available for f-structures (areas/polygons:
Presentation:
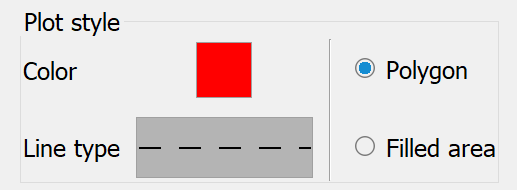
The preset colour and line type can be changed here as required when the structure is displayed. The line type is only relevant if the area structure is to be displayed as a polygon. If the structure is displayed as a filled area, the selected colour is used. This helps to differentiate between the individual structures in the graphical display.
The changes to the structure only become effective when you confirm with the OK button.
 Menu item: Import…
Stand: 06.03.2026 | 