In the stochastic allocation of data, a distinction is made between correlated and uncorrelated data.
Uncorrelated generation
In the uncorrelated generation of the data, no similarity of the data depending on their position in relation to each other is taken into account.
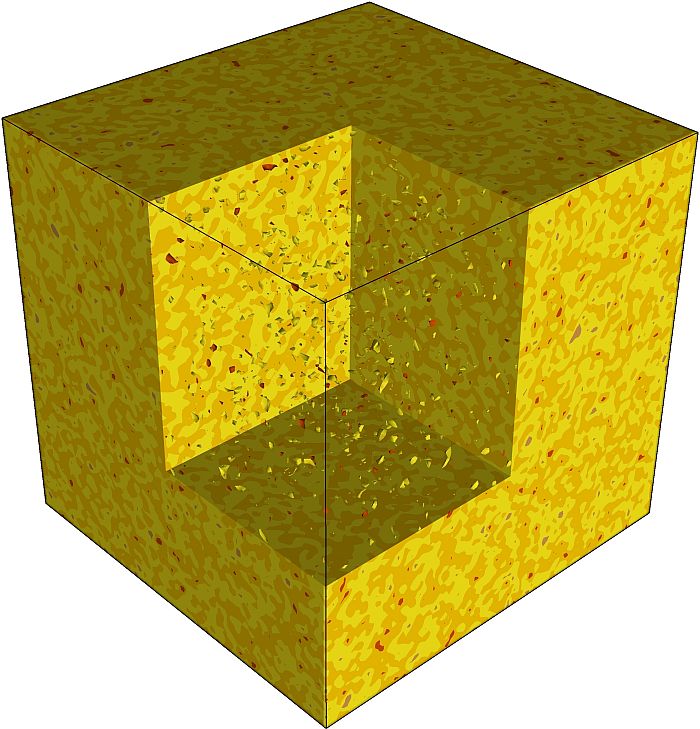
Stochastically generated data without spatial correlation
Input window: Uncorrelated generation
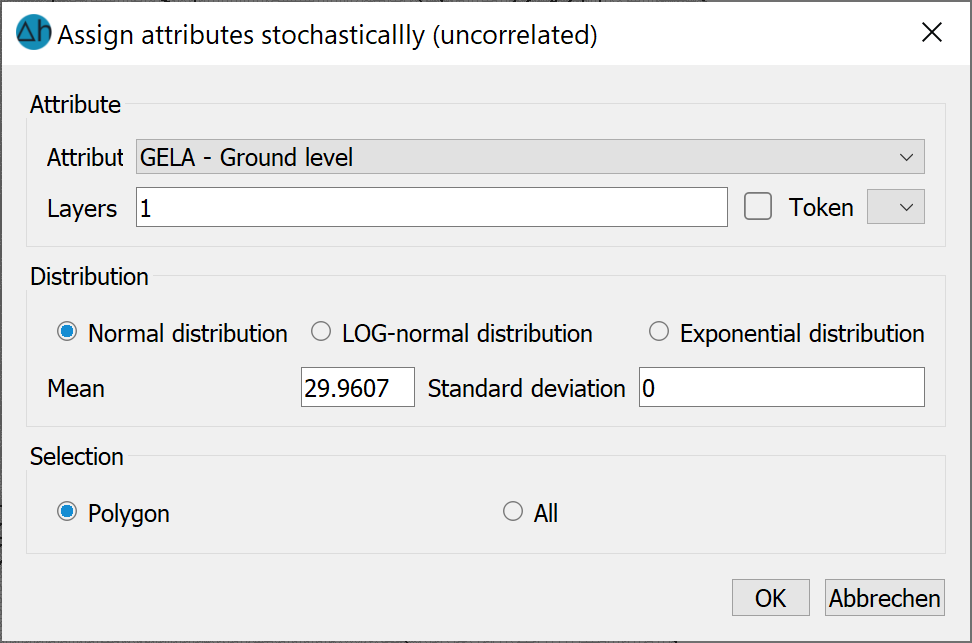
Firstly, the attribute, the attribute token and the layer (for 3D models) are selected.
When generating uncorrelated data, you can choose between the normal, log-normal and exponential distribution. The distribution functions are explained in the following chapter.
The mean value (μ) of the values to be generated is entered in floating point format.
The standard deviation (σ) of the distribution to be assigned is entered. It is not necessary to enter a standard deviation when selecting the exponential distribution!
The generated values can be assigned by area or to all nodes or elements of the layer.
Correlated generation
Correlated data are generated by SPRING using the "turning bands" method (see e.g. "A. Tompson, R. Ababou, L. Gelhar"; Implementation of the Three-Dimensional Turning Bands Random Field Generator; Water Resources Research; Vol. 25, No. 10, 1989). The implemented algorithm is based on an exponential approach for the variogram, in which the correlation lengths in the three spatial dimensions can be different.
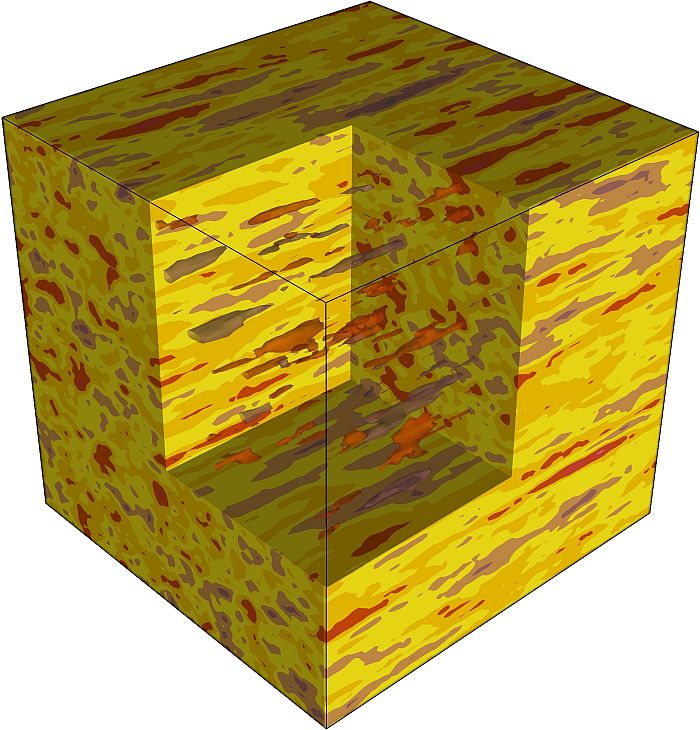
Stochastically generated data with spatial correlation
Input window: Correlated generation
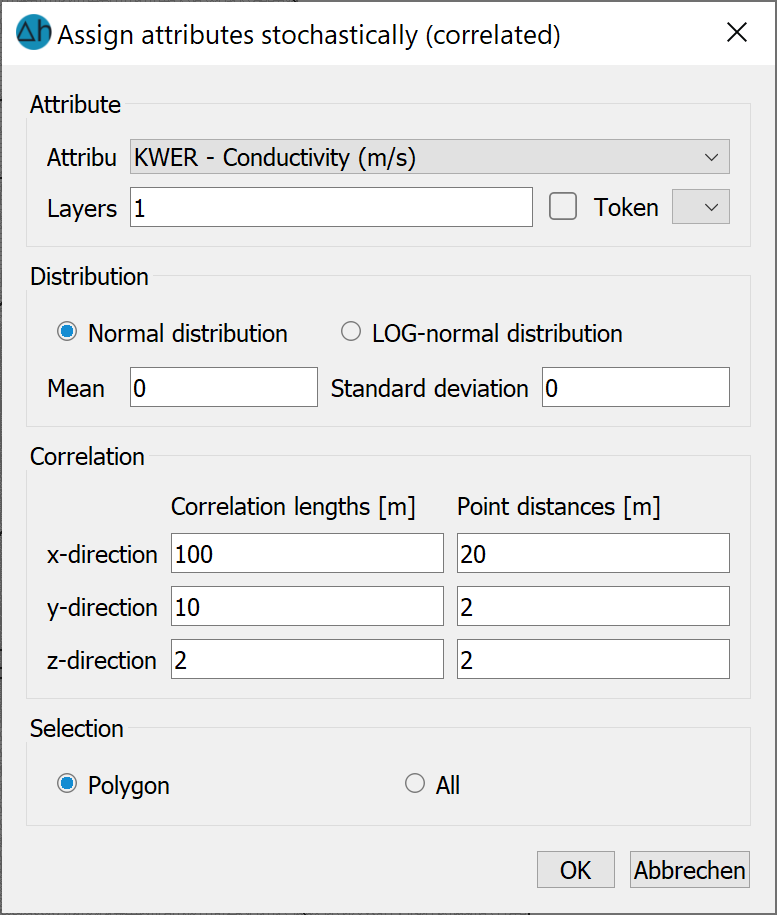
Firstly, the attribute, the attribute token and the layer (for 3D models) are selected.
In contrast to uncorrelated generation, you can only choose between the normal and log-normal distribution for correlated data.
When generating correlated data using the turning bands method, it is necessary to enter the correlation lengths (in metres). For a reasonable realisation, the mesh density must be significantly smaller than the entered correlation length. The range within which values are to be generated must be more than twice as large as the correlation length in the corresponding direction.
The implemented algorithm requires "generalised" information about the grid density. The point distances to be entered for this should lie between the smallest and the average side lengths in the corresponding directions. The quality of the realisation increases the smaller the numbers entered here.
The computational effort for the generation of correlated data increases very quickly with the number of data to be generated and small point distances.
Only when the number of generated data is sufficiently large and (in the case of correlated generation) the relationships between mesh density, point spacing and correlation lengths explained above are taken into account does a typical picture of the distribution emerge when counting the generated values.
 Distribution functions
Stand: 06.05.2025 | 