Some initialisation parameters for plotting are defined via the layout window:
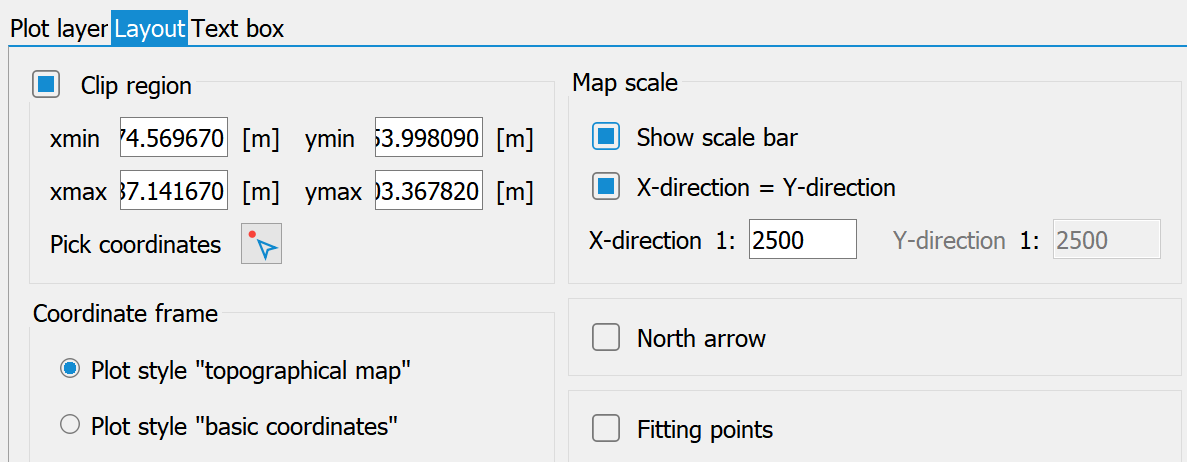
Clip region
If the plot type Top view/map presentation is selected, a region (batch command CLIP ) can be defined by clipping. The "Clip region" checkbox must be activated for this. In this case, the defined region is used for the display instead of the extreme maximum model coordinates. The coordinate frame is adjusted accordingly. Graphic objects that protrude beyond the region are clipped.
If the Pick coordinates ( ) input is selected, two diagonally opposite points can be snapped interactively in the SPRING interface to determine the region.
Map scale
Each horizontal plot can be supplemented with a scale bar (batch command MASS ) by activating the Show scale bar checkbox. The scale bar is displayed centred above the title block. With different scales in the x and y directions, the scale bar is orientated to the scale in the x direction.
To each horizontal plot a scale bar (batch command MASS ) can be added. The scale bar is printed centred above the text box. At different scales in x and y direction, the scale bar is based on the scale in x direction.

The default scale of the plot is based on the scale specification (attributeMASS) in the model file. The display scale can be changed in the text fields. If the display is to be exaggerated in the y-direction, the mode "x-direction = y-direction" must be set beforehand. Only then can a different scale be selected in the y-direction than in the x-direction. The entered scale specifications are realised in the batch file by the batch command SKAL (conversion to scaling factors.
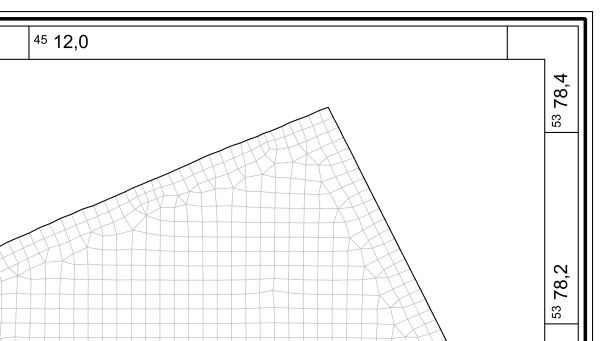
Coordinate frame
Each map display is provided with a coordinate frame. You can choose between two different representations of the coordinate frame (batch command KOOR ).
Plot style “topographical map“
This frame type is suitable for topographical maps, as these are usually displayed in UTM coordinates.
Plot style “basic coordinates“
This coordinate frame type represents a frame with a simple labelling of the axes with coordinates.
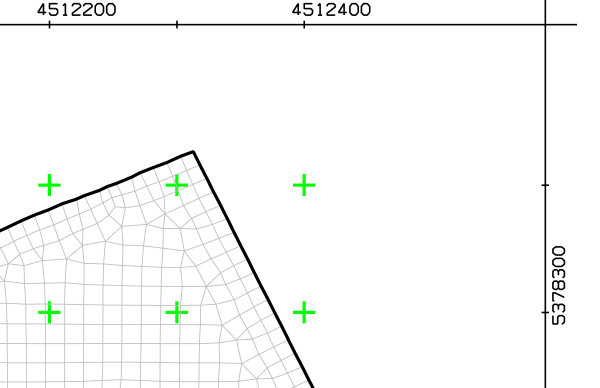
Basic coordinates frame with fitting points (green)
Fitting points
By activating the checkbox Fitting points, coordinate crosses are displayed in the coordinate frames. The colour is preset to black; it can only be changed directly in the plot via Layer  Modify colours...
North arrow
Plotting a north arrow only makes sense in the plan view; rotated coordinate systems are not taken into account here (batch command NORD ).
The north arrow is displayed centred above the title block if the checkbox is activated.
Stand: 02.06.2025 | 