A vertical section can be created by selecting this menu item. The following input window appears. Apart from the left-hand input block, this is almost identical to the input window for a top view/map display:
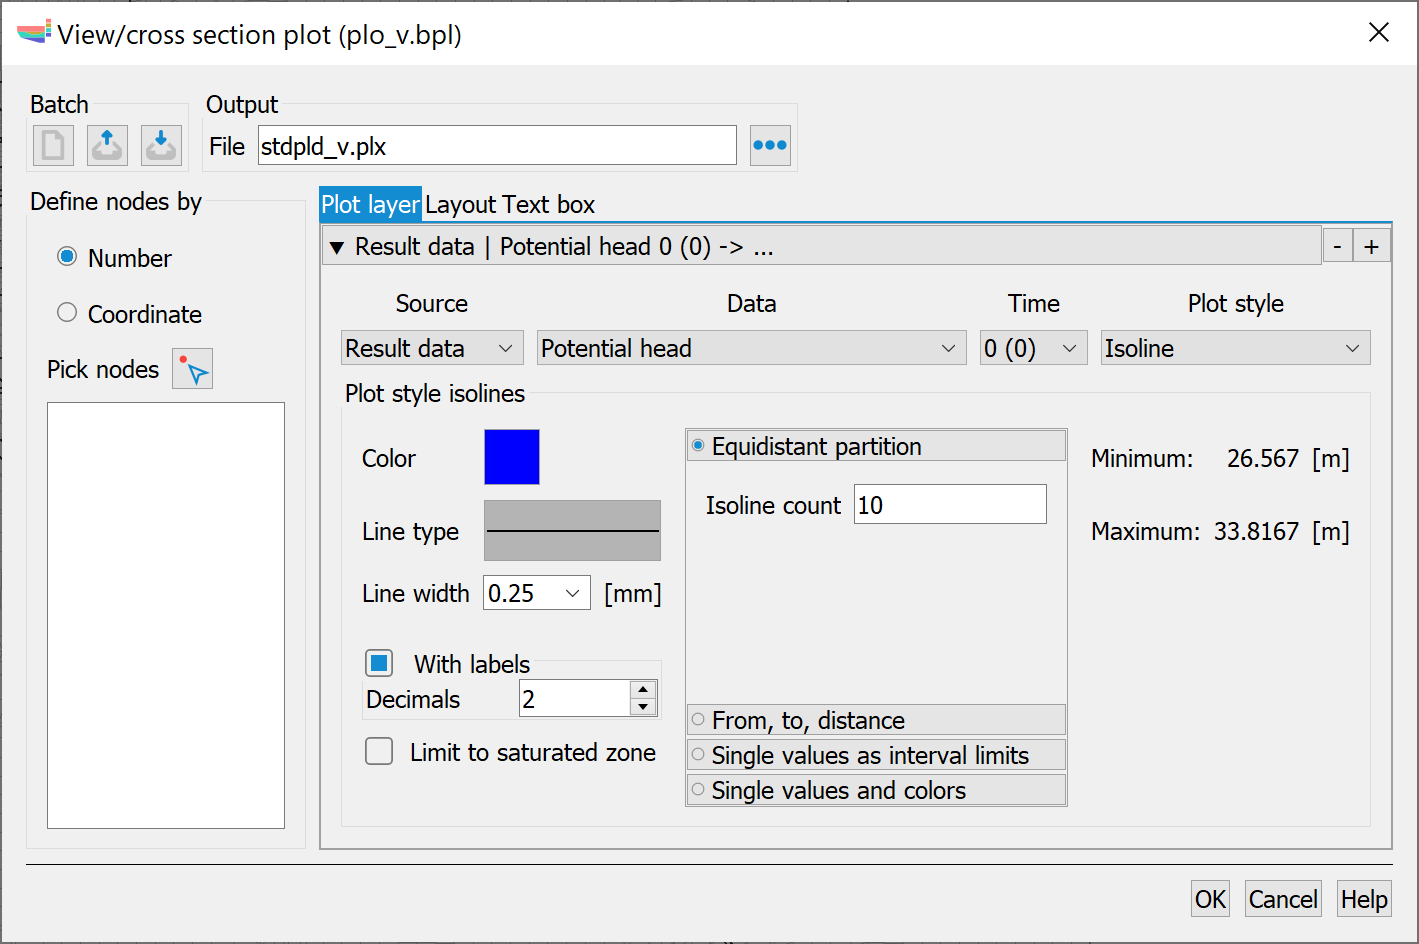
If data is to be displayed in a vertical section, the position of the section must first be defined (batch command VERT ).
There are two ways to do this:
Numbers
The position of the section is defined via node numbers. These can be selected interactively in the SPRING interface (Pick nodes  ).
).
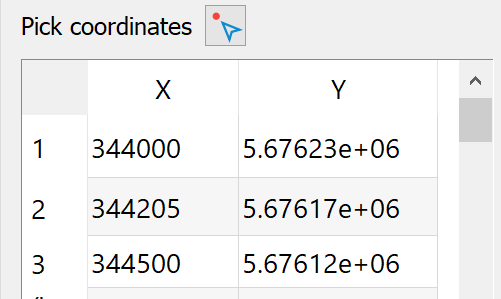
Coordinates
The position of the section is defined using x and y coordinates. The coordinate pairs can be entered directly in the table that appears or selected interactively in the SPRING interface.
Remark:
If coordinates are used instead of node numbers, SPRING determines the closest nodes to the entered coordinates and then places the section through these nodes and not exactly through the entered coordinates!
Furthermore, the input blocks essentially correspond to those described in the top view/map creation. Minor restrictions must be observed for the individual display types. For node data, for example, only the display types:
Isolines
Filled areas
Values
are possible.
It is not possible to display measurement data in a vertical section:
After creating a vertical section (name.plx), a structure file (name.str) containing the coordinates of the section polyline is automatically written. This file can be used to mark the cutting polyline of the vertical section by importing the structure or overlaying the file in a plan view.
The details of the representation of areas, hatching, isoline etc. are described in the chapter "Types of display”.
The advanced settings are described in detail in the chapter "Advanced settings"
 Types of display
Stand: 02.06.2025 | 