A hydrograph plot (batch command GANG) is only possible after a transient calculation for node or element data.
After selecting the Hydrograph plot style, the following input area appears:
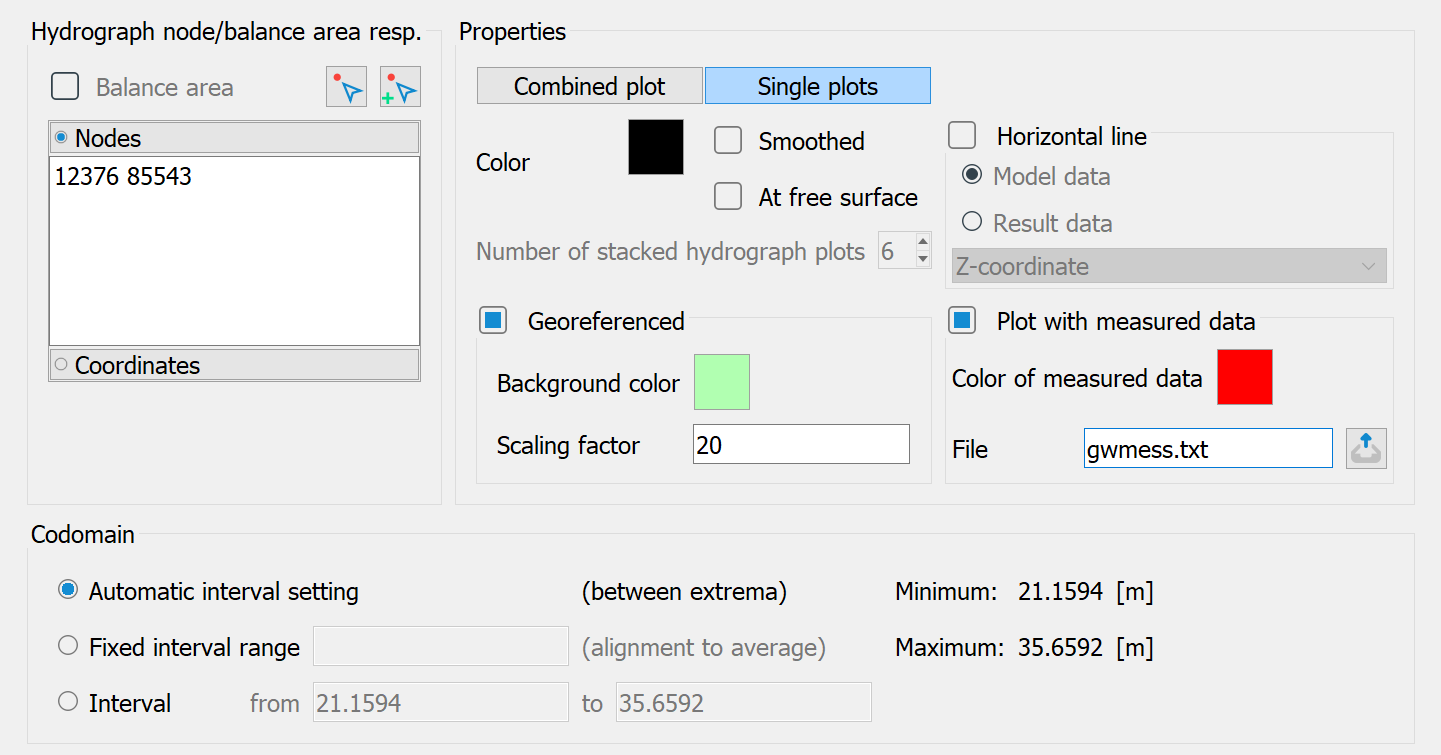
Hydrograph node/balance area
When selecting Nodes, the numbers of the nodes or coordinates for which hydrographs are to be plotted are specified. If coordinates are selected, the hydrograph is created for the nearest node.
The selection of Balance area is possible if nodes or elements have been summarised via balance areas (attributes BILK, BILE). Rate hydrographs are then specified for balance area numbers.
The input is format-free with any number of values per line. The individual numbers must be separated by a blank or a comma.
By activating the pick button ( ), you have the option to pick the desired nodes or the coordinates in the SPRING interface. If you want to add further nodes or coordinates, select the additional pick button (
 ).
).
In the 3D case, only the nodes or elements of the top layer can be picked. Numbers of lower layers can be selected by post-processing in the text field (adding a corresponding multiple of the 3D number offset to the numbers.
Properties
Common to all visualisations is the option of displaying the hydrographs in the 3D model on the free surface and/or smoothing the hydrographs (interpolation of intermediate values).
The hydrographs can be displayed in three different ways:
Combined plot (all charts in one screen)
If the hydrographs are not to be drawn individually, but all in one image, the following input option appears when the button is activated.
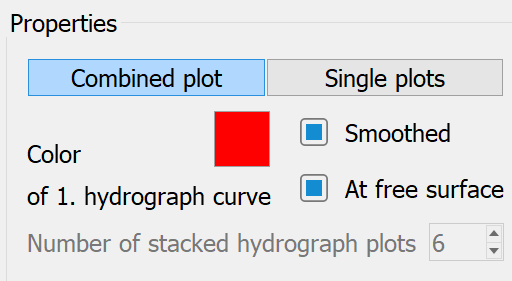
The selected colour is used for the first hydrograph. The next colour in the colour palette is used for the subsequent hydrographs. In the 3D model, it is possible to plot the hydrographs at the free surface of the nodes. The hydrographs can be smoothed.
Single plots (one image per hydrograph
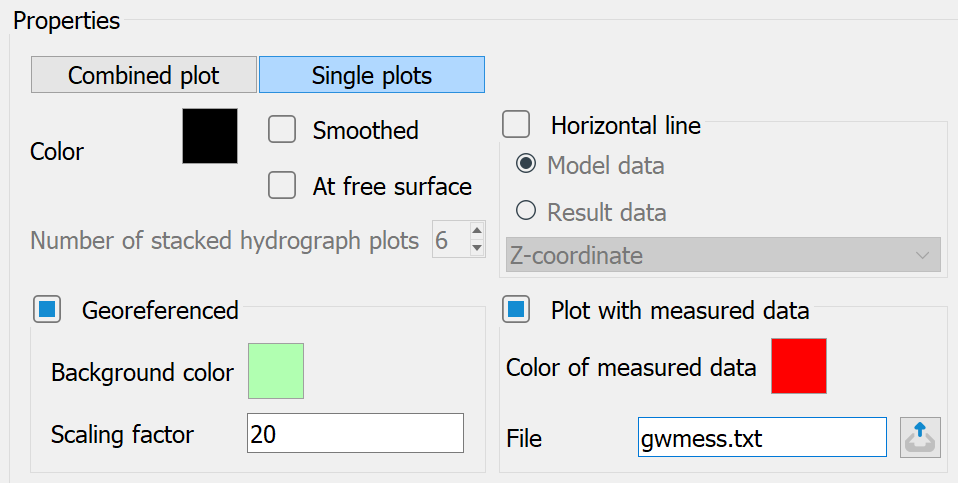
If this display type is selected, any number of chart plots can be displayed next to each other. The number of hydrograph plots on top of each other defines how many individual hydrograph plots are displayed in one column in the resulting plot. For example, with 36 individual node hydrographs and the specification 9 in this window, 4 columns with 9 hydrograph plots each are displayed one above the other in the result plot.
A steady state data type can also be plotted as a horizontal line in the individual plots.
A useful visualisation is, for example, the ground surface at the nodes in order to assess the water table depth for potential head hydrographs.
It is also possible to display the measured values at the nodes for individual plots if a corresponding file with target values is available (e.g. for a transient calibration). The colour of the measured values is selected using the button. The name of the file with target values can be entered manually or selected via the file selection window.
The format of the setpoint file is described in detail in the chapter "File with target values for chart display" .
Single plots (georeferenced hydrographs)
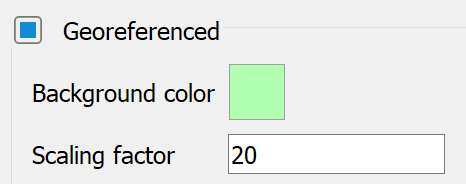
If the "Georeferenced" checkbox is activated, georeferenced hydrograph diagrams are created at the selected nodes/elements. These can be overlaid in the model or topographical representations. The bottom left-hand corner of the diagram corresponds to the respective model node or element centre point. If the colour "black" is selected as the background colour, the hydrograph has a transparent background; if other colours are selected, the background is "opaque". The scaling factor influences the image size of the chart diagram.
A horizontal line or measured values can also be plotted for georeferenced hydrographs.
Codomain
Value ranges between which the charts are to be displayed can be defined for all display types.
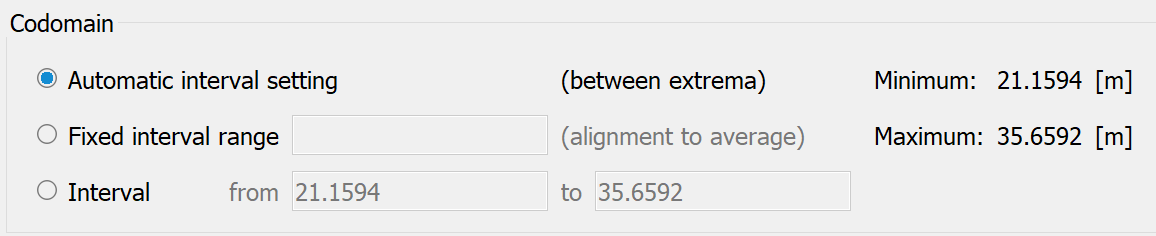
Automatic interval setting
With automatic interval setting, each chart is displayed exactly between its extremes.
Fixed interval range
Here it is possible to specify a fixed interval based on the mean value of the hydrograph data.
Interval from, to
Here it is possible to define the exact upper and lower limits of the display.
If limits are entered that are exceeded or undercut by some values of the selected chart nodes, the programme changes these limits automatically.
The size of the setpoint markers and the names of the measuring station (KTXT) in the chart plot can be changed in the "plogeo.ini" file using the HSOL and HKTX parameters.
 Data dependent special features in the display
Stand: 02.06.2025 | 