The calculation of streamlines is only possible following a two-dimensional horizontal flow calculation (steady state or transient). To visualise the streamlines (= flow-related path lines), they must be exported: File  Export
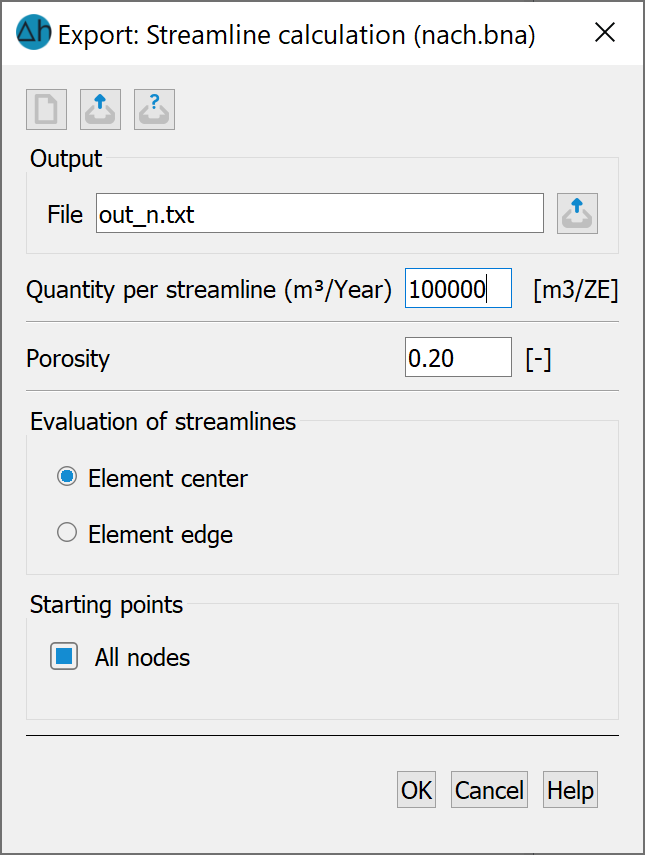
  Streamlines.... The following input window appears:
The input blocks are explained in detail in chapter "Data export - Output of streamlines".
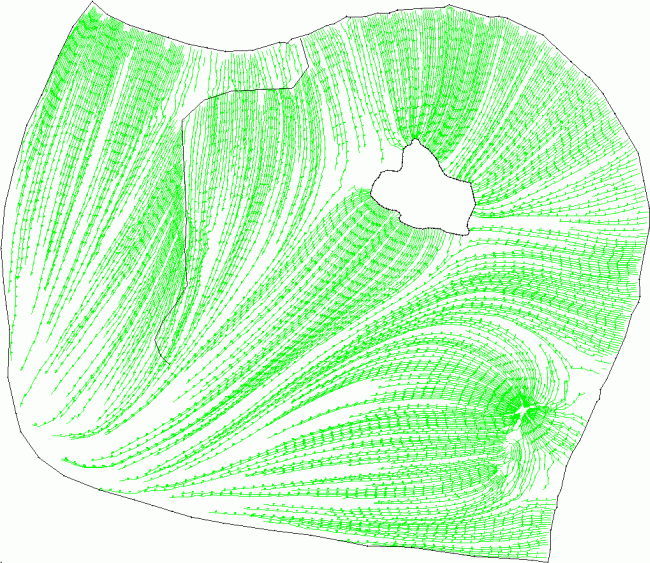
The specification of the "Rate per streamline (m³/year)" requires a little sensitivity for the existing water flow rates in the model. In the following example, the calculation is based on 10,000 m³ per year and streamlines are started in all nodes (the specification of individual node numbers is only permitted for abstraction wells). After the calculation, the item: Result data: Streamlines can be selected under Create Plot. The input window is identical to that for the path lines and requires the same parameters. Here "Markings after: 100 m" has been set, the result is the following image:

Streamline for a volume of 10,000 m³ per year
Streamlines close to each other mean large flow rates of water, in areas with isolated streamlines less water flows at a lower velocity. Sharp bends in the streamlines are an indication of jumps in the K values of the neighbouring elements.
 Catchment area determination with Schlieren (FLIC)

