The following input window appears:
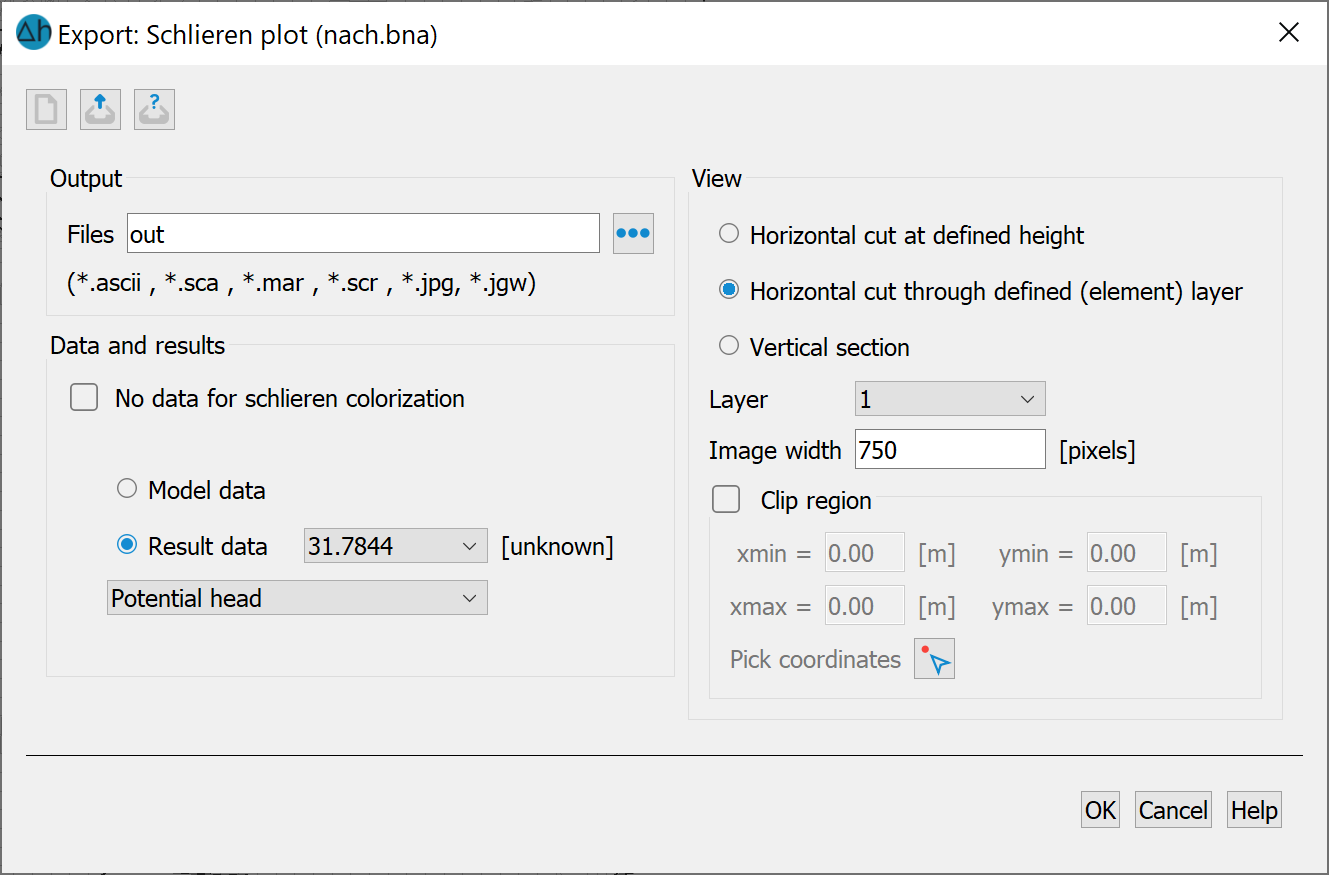
Input for the Schlieren plot
Output
This determines the name of the output file to which the specific endings are appended.
|
File |
Contents |
|
<name>.ascii |
For a 2D model or a horizontal section through a 3D model, this file contains the velocities required for FLIC at the mesh nodes and element centres and an incidence for the triangular mesh used in FLIC (SPRING quadrilaterals are divided into 4 triangles, SPRING triangles into 3 triangles). For a vertical section, this file contains the velocities at the grid points required for FLIC. |
|
<name>.sca |
This file is only generated if scalar data is to be output for colouring the streaks on the grid. For a 2D model or a horizontal section through a 3D model, this file contains the necessary data values at the grid nodes and element centres, supplemented by the triangle incidence used in FLIC. In the case of a vertical section through a 3D model, this file contains the values of the data at the grid points. |
|
<name>.mar |
This file is only generated if markings are present (but not for a vertical section through a 3D model). Point markings are realised as "asterisks". If these point markings are not desired, the corresponding part in the resulting file (after the comment "Point markers") can be left out. |
|
<name>.scr |
This file can be used as a command file for FLIC (call: "flic cmd=<output file>.scr"). The file name of the bitmap to be generated by FLIC is preset to <output file>.jpg (command line "out=..."). (Command line "out=...".) Alternatively, a pgm format can also be selected here by changing the suffix to .pgm. If markings have been output as an overlay file, the file is overlaid with the "overlay=..." command. If scalar data has been output on the grid, this is used for colouring via the "colorfield=..." command for colouring. The extreme values of the scalar data in the "colorrange=..." command play a decisive role in the colouring. The colour palette used can be shifted by modifying these extreme values. If no scalar data is used for colouring, the velocities are decisive for colouring ("colorfield=mag"). The extreme velocities in the "colorrange=..." command are also decisive for the colouring.
|
|
<name>.jpg |
Image file |
|
<name>.jgw |
Georeferencing file associated with the image file |
Data and results
The default setting is to display the velocities. Data for possible colouring of the streaks can only be optionally selected by deactivating the checkbox.
By selecting the model or result data, a submenu appears in which the data types that have data at all nodes or elements are listed. If transient result data is available, the desired point in time can also be selected.
View
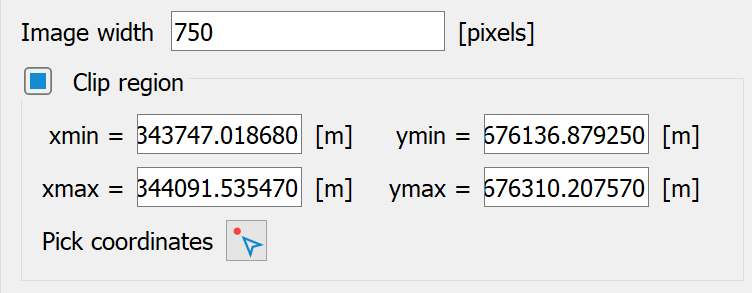
Image width in pixel
The horizontal resolution of the schlieren image can be specified in pixels. The resulting vertical resolution is determined in the calculation and passed on to FLIC. This prevents unintentional distortions, especially during clipping. The preset size for the bitmap to be generated by FLIC is set to 750 pixels in the x-direction for 2D models or horizontal sections through 3D models and is rounded in the y-direction according to the model size. With vertical sections, the preset size is based on the defined grid (10 times the number of grid points) (command line "size=..x..").
Clip region
If the "Clip region" checkbox is activated, a rectangle can be defined here in which the streak image is to be displayed.
By activating the Pick coordinates button ( ), the points can be captured interactively in the SPRING interface.
For 3D models, you must also select whether a horizontal or vertical section is to be exported.
The position of the horizontal section can be defined in two ways:
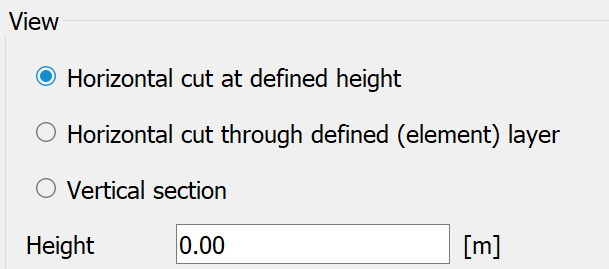
Horizontal cut at defined height:
The height (in metres) must be entered.
Horizontal cut through defined (element) layer:
It is necessary to enter the (element) layer number, in which case the dialogue changes from "Height" to "Layer".
In the case of a vertical section, the schlieren visualisation is not based on the original mesh, but on a rasterisation of the sectional area. The streaks are displayed on the basis of the velocities calculated at the grid points. The finer the grid, the better the colour representation. However, from a certain point onwards, reducing the grid width in the FE mesh no longer leads to any improvement in the visualisation, but merely increases the computational effort many times over. The following inputs are required to define the position of the vertical section and the grid:
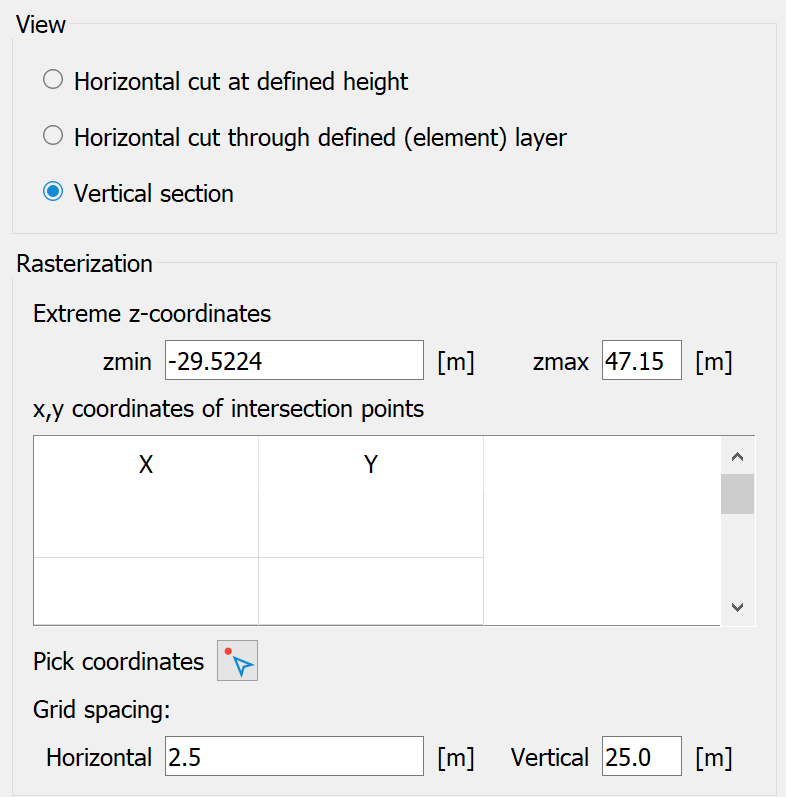
Rasterisation data
Extreme Z-coordinates:
The minimum and maximum height for the upper and lower limits of the vertical section (zmin and zmax) must be entered.
Position of the cut:
When selecting a vertical section, the position of the section in the (x,y) plane must be determined.
At least two points must be specified in the horizontal plane in order to define the section course. This can be done manually by entering the coordinates directly or interactively in the SPRING interface ("Pick coordinates”).
Set the grid spacing:
The grid spacing is determined by entering the grid sizes in the horizontal and vertical directions.
During the calculation, a velocity vector and possibly the value of the 'scalar' data are calculated at all coordinates defined by the grid spacing and grid corners (x, y, (z)).
The buttons at the top of the input window allow you to reset the input parameters ( ), open an existing batch file (
 ) or save the current batch file under a different name (
 )
)
 Batch file for the Schlieren plot
Stand: 25.02.2025 | 