Creating the node track file
The node track is defined in or against the flow direction of the receiving watercourse (observe the sequence of the nodes!):
1, 2, 3, 5, 6, 4, 8,+
As the format of the node train file corresponds to that of the model file, the following procedure is used to create this file:
The LERA attribute is deleted in a temporary copy of the model file. Instead, any value is assigned to LERA via the line structure of the watercourse to be interpolated, for example. All nodes of the watercourse must be contained in LERA (check by point attribute representation). After saving the model, the LERA data set is copied in the editor and pasted into a new ASCII file. If necessary, "from-to" characters must be replaced by the missing node numbers. The finished file may only contain the sorted node numbers.
Creating the file containing the hydrograph data
The following figure serves as an example for creating a hydrograph file. Gauge values are available at two points of the receiving watercourse. At one measuring point (P2), however, a measured water level is missing for a time step.
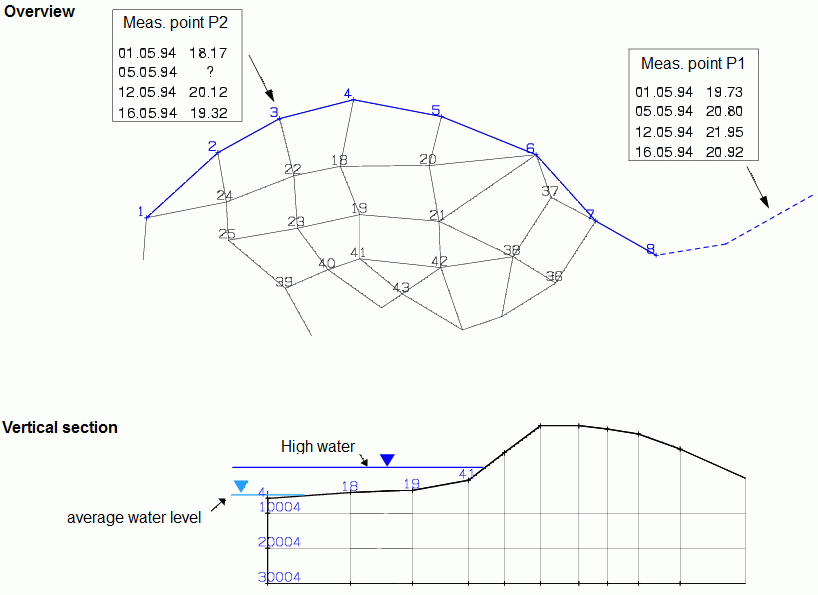
Bild: Interpolation to a receiving water node with a floodplain
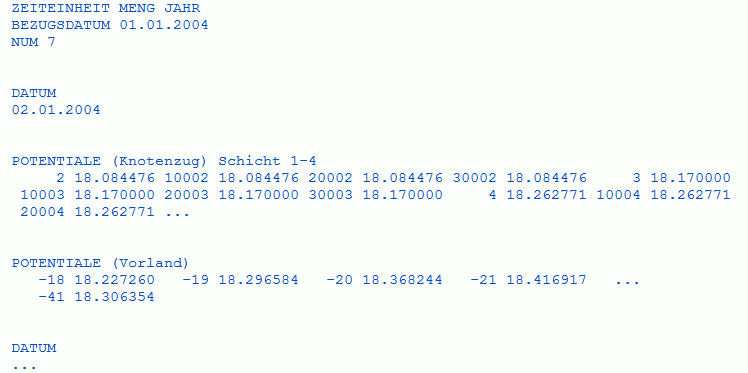
The chart file begins with the date line. An empty line follows, with the the data blocks of the individual nodes next, with each node data block separated by an empty line:
DATUM 01.01.1994
8 987.00
01.05.1994 19.53
05.05.1994 20.80
12.05.1994 21.95
16.05.1994 20.92
3
01.05.1994 18.17
05.05.1994 19.28
12.05.1994 20.12
16.05.1994 19.32
The the value of 987 next to node 8 in the first line of the first data block means that the specified gauge values do not apply directly to node 8, but to a point 987 metres away. The missing value (see picture above) for the time 05.05.1994 at the measuring point P2 (node 3) was supplemented by an estimated value.
This hydrograph data file must be created manually in the appropriate format.
Creating the floodplain node file
Firstly, a line structure of the main upstream watercourse (Structure  New Lines) is created in SPRING. The respective peak value of the flood wave is assigned to the "gauge node"..
Example:
Gauge P1 = Node 1 Peak value = 15.94 m NN
Gauge P2 = Node 68 Peak value = 16.20 m NN
Gauge P3 = Node 112 Peak value = 17.75 m NN
This main watercourse line structure is assigned to any free node data type (e.g. KKKK) with an accuracy of approx. 1000 m. The data type is then modified by calculating GELA - KKKK = KKKK and limiting the values of KKKK to maximum equal to 0 (Attributes Compute Calculator... followed by Attributes Compute Limit...).
In the next step, all values with KKKK = 0 are deleted via the Attributes Delete... menu item, selecting KKKK and deleting "only values = 0.0". The attribute is then displayed as a circle (View Show attributes Attributes...). The KKKK attributes of the nodes of the water courses that are located, e.g. behind a dyke or generally too far inland, are now deleted manually.
After a model check, the KKKK attribute is exported via File Export... Formatted data output... in No., value format. The output file is reduced to the column of node numbers using Microsft Excel (or similar software). This completes the floodplain node file.
If all the necessary files are available and have been assigned accordingly in the input window, the interpolation is carried out after the model check.
The output file "out.i" of the interpolation contains the transient water level data for the main receiving watercourse and the floodplain nodes (marked with "-"). If the water level of the receiving watercourse are taken into account in several layers, these are also included in the output file.
This is converted into the format of a transient file with the following header lines:
The NUM 7 flag indicates that the node numbers are written to the out.i file in I7 format. (The normal format for the transient input file is I6).
Input Parameters in the attribute menu - assignment by interpolation
Stand: 30.01.2025 | 