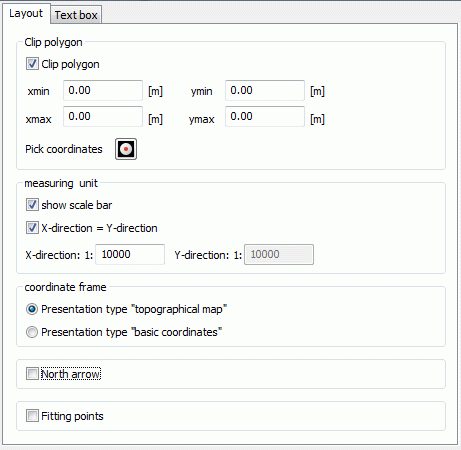
Some initialization parameters for the plot generation are set through the layout window:

Clip polygon
In case of a 2D model or a horizontal section of a 3D model, you can define a Clipping (batch command CLIP ). Hence, the program uses for the plot the new window instead of the automatically computed extreme model coordinates. The coordinate frame will be adjusted. Parts of the plot which are outside the new frame are not plotted!
By selecting the button Pick coordinates  two diagonally opposite points can interactively be caught in the SPRING-surface to determine the section.
Measuring unit
To each horizontal plot a scale bar (batch command MASS ) can be added. The scale bar is printed centred above the text box. At different scales in x and y direction, the scale bar is based on the scale in x direction.

The default scale of the plot depends on the scale factor in the model file (attributeMASS).
To change the representation scale, use the text boxes. You can only super elevate the representation in a vertical section after having switched off the mode "x=y". Only then you can define the scale in y-direction as different from the scale in x-direction. The scale values are realized in the batch file by using the batch command SKAL (transfer into scaling factors).
Coordinate frame
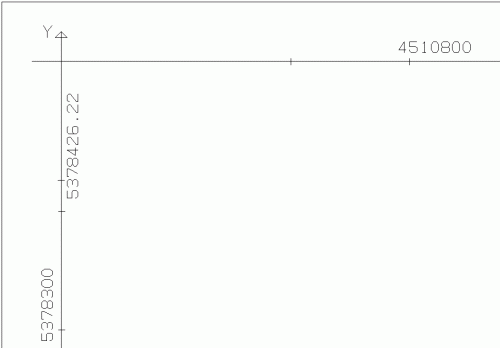
Each horizontal section, vertical section or 2D plot has a coordinate frame. The user can choose between two different representations of the coordinate frame (batch command KOOR ):

Presentation type „topographical map“
This coordinate frame type presents itself to topographic maps because they are usually presented in Gauss-Krüger coordinates.


Presentation type „basic coordinates“
This type is a simple frame with coordinate axes.

North arrow
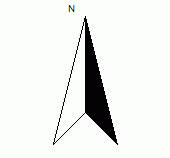
The north arrow only makes sense in horizontal sections and 2D plots of a horizontal model. Rotated coordinate systems are not considered here.
(batch command NORD ).

The north arrow is printed centred above the text box.
Fitting points
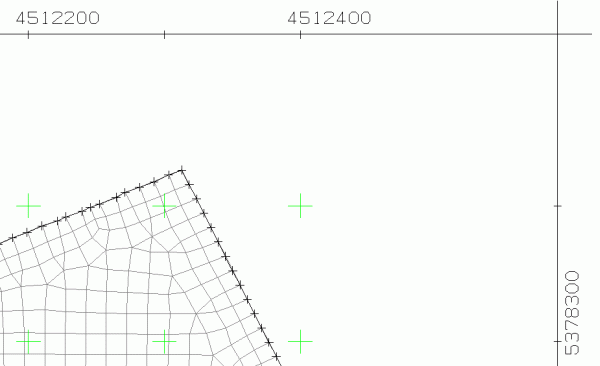
By checking the box fitting points coordinate crosses are represented in the coordinate frame. The default colour is black, it can be changed only directly in the plot via the menu item Layer  Modify colours.
Example for the representation of fitting points (green) in a plot:

