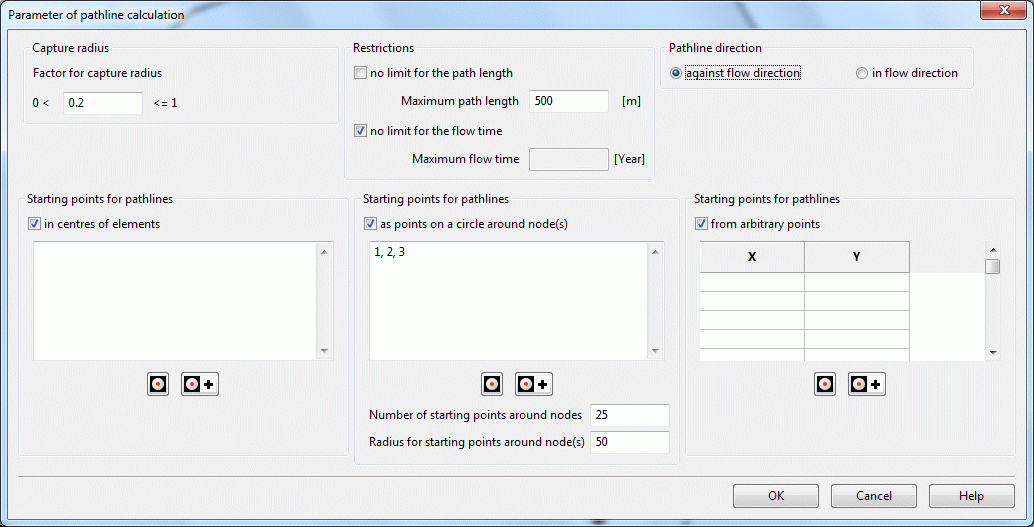
For the presentation of path lines the checkbox “Path lines” has to be enabled in the flow calculation with the module GEONEU (steady-state flow) or INSTAT (transient flow). The following window appears in GEONEU in which the criteria for the path lines are established:

Input for path lines
The input window of the module INSTAT differs by the lack of the input blocks "restrictions" and "pathline direction".
Capture radius
While tracking path lines on the basis of the calculated velocities near a well, the path line will run directly toward the well only in exceptional cases. To avoid oscillation of the path line around the well, a check is performed to determine if the path line passes within the area of influence of the well. If yes, the path line will be captured by the well. Only nodes lying on elements having a well as one of its corner nodes are considered. The "capture radius" is actually not a radius but a scale factor for the path line coordinates. The capture criterion is therefore dependent on the element size; in addition it is weighted according to the pumping/injection rate at the well. If necessary, the default value can be changed (always > 0).
Restrictions
To limit the path lines, two parameters can be used. You can define the maximum length (m) and/or the maximum flow time (unit of time defined in the *.net-file).
Pathline directions
The direction of the path line can be either in or against the flow direction.
Starting points for pathlines
When selecting the menu items "Starting points for path lines " open windows in which the starting points are established. Using the button  or
or  an interactive selection in the user interface is possible. A combination of all three types of starting points is allowed.
In the path line calculation is a porosity of 0.2 considered. It can be changed via the batch file of the flow computation.
A typical application of the path line representation is the issue of catchment areas of withdrawal wells, e.g. which area in the vicinity of the well needs to be shown as a water protection zone (e.g. 50-day protection zone). The representation contrary to the direction of flow provides this.
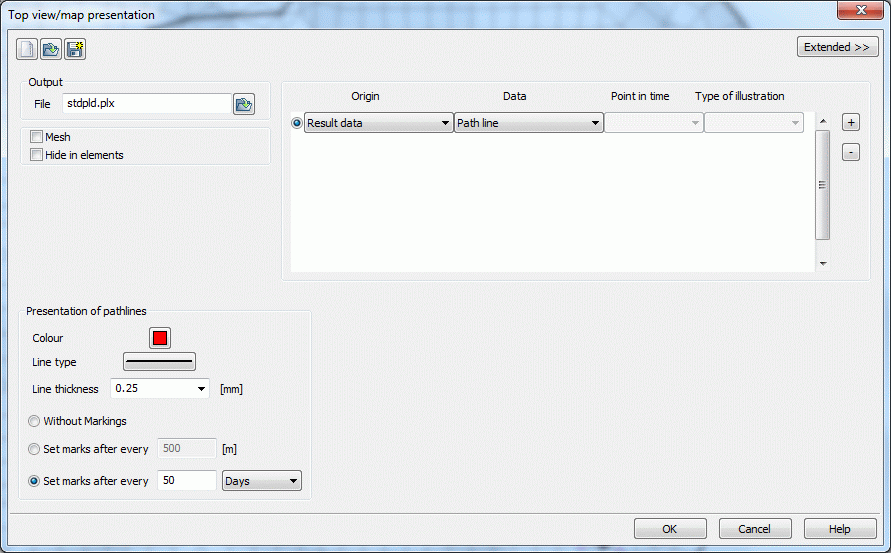
After the flow calculation the plot representing the path lines has to be created with the plot generation. This is done via File  Plot generation
  Top View/Map presentation and then selecting Result data
  Path lines. The following window opens:

Criteria of path lines in the plot generation
The statement "Set marks after every 50 Days" means that on the path line a marker after every 50 days is set. To identify the 50-day protection zone of a well by the time markers, the corresponding 50-day isochrone can be constructed manually. For the following image, the above parameters and the node number of the wells (1, 2, 3) were used:

Path lines with a length of 500 m and a marker after every 50 days
On this picture the parameters set in the flow calculation are clearly visible. The path line ends after reaching the 500-m limit, the distance corresponds to the well "radius for the starting points around node(s) = 25 m, and there are 50 path lines.
However, it requires a little practice, to obtain a meaningful picture of this problem.
 Theory of the stream line calculation
