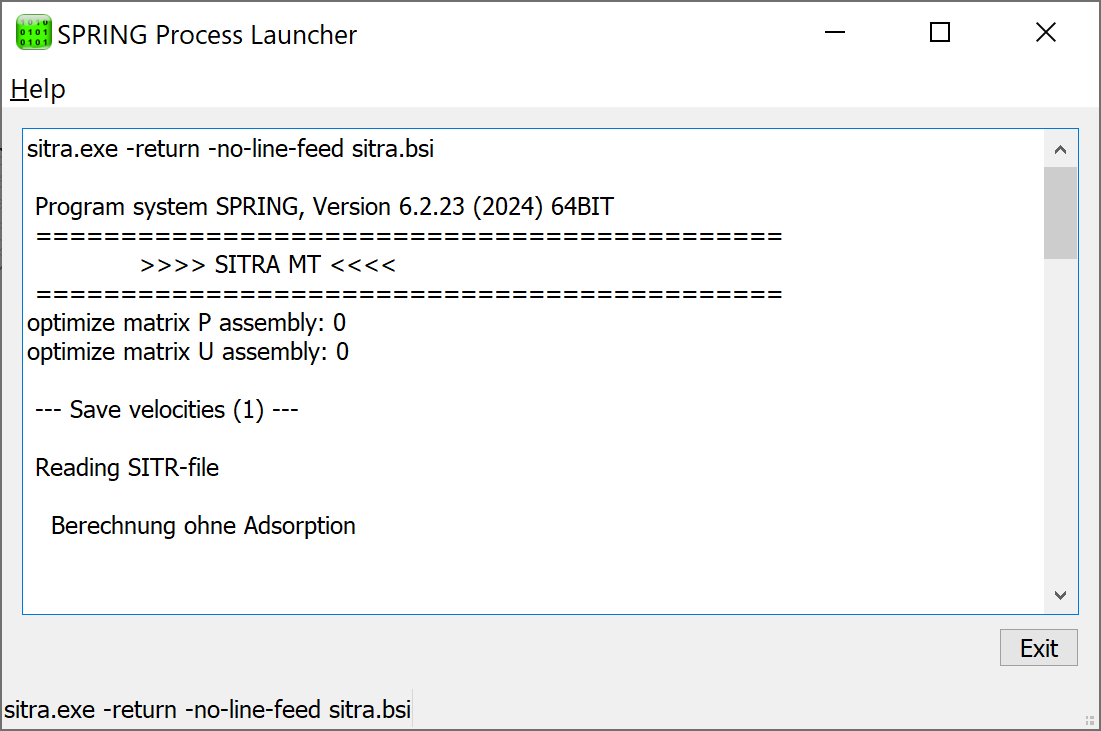
After starting the calculation, the log window of the calculation run, the SPRING Process Launcher, appears.

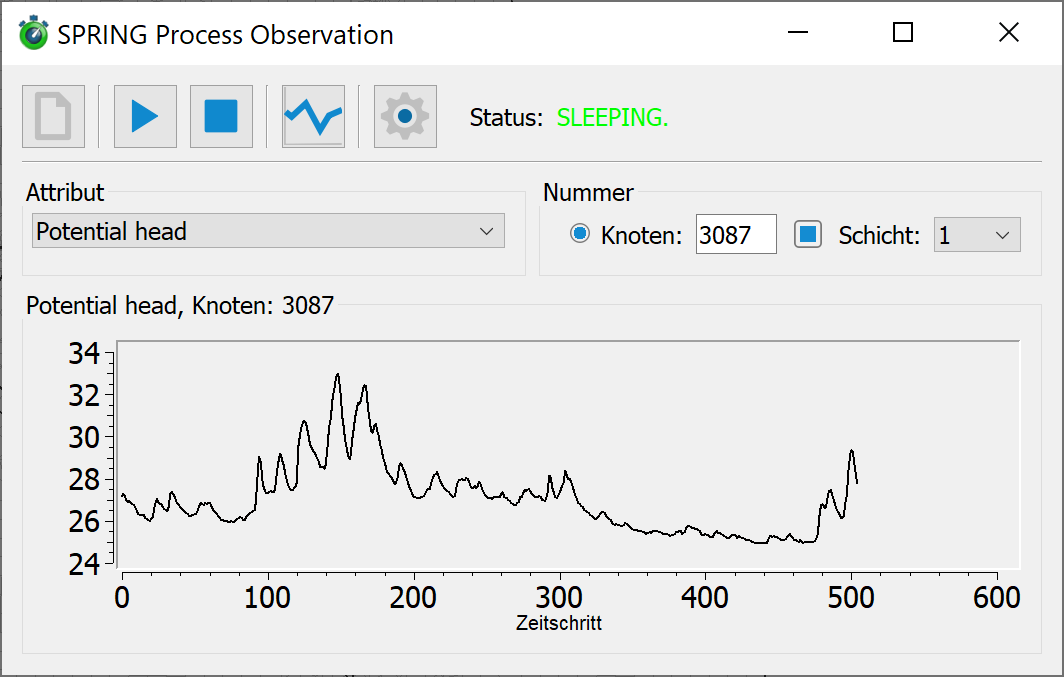
During a transient calculation, it is possible to follow the progress of the calculated results live by starting the SPRING Process Observer (press the button  ) or by entering the obs command in the command line. The following window appears:

After starting, the directory in which a running calculation is to be monitored must first be selected using the 1st button ( ). If several calculations are running at the same time, you can use this to switch to another working directory in which a hydrograph is to be monitored.
Firstly, the data type and the node (or element) to be monitored can be selected using the Attribute and Number fields. Observation of the calculation results is started using the 2nd button: 
The hydrograph is displayed successively.
The running process can be stopped by pressing the 3rd button:  . An attribute and a node or element can then be selected and observed again.
The 4th button ( ) can be used to save the currently observed hydrograph as a file in csv format.
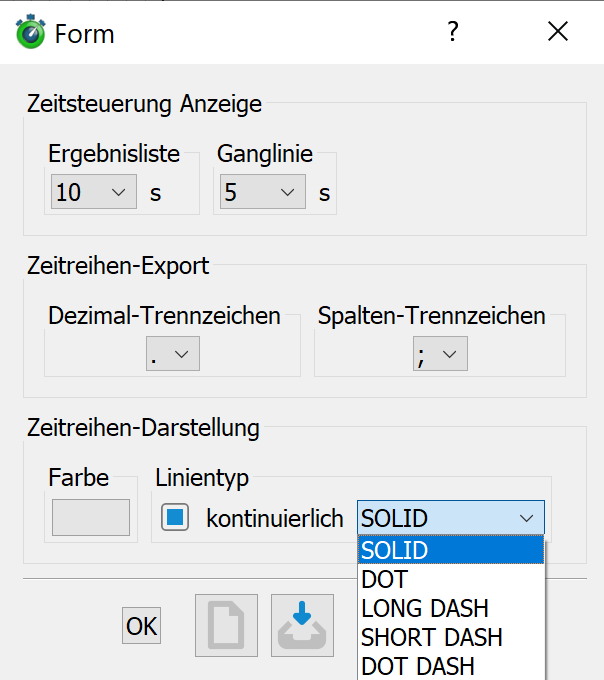
A transient calculation that has already been completed can also be called up with the Process Observer. The settings for the chart storage can be changed by pressing the button  . The following input window appears:

Time control display
In extensive models, the calculation of a time step can take some time.
The seconds specification tells the process at what interval it should check and display the progress of the time steps (chart) or the change in the results (results list) in the background files. Checking the results is primarily useful for data types that only "kick in" when a certain event occurs (e.g. SICK attribute).
Time series export
The user can select which decimal and column separator is to be used in the chart file.
Time series display
The colour and line type of the chart display can be freely selected.
 Visualization of velocity distributions (Software STRING)
