Various methods have been established for the visualisation of velocity distributions from flow simulations. These include the visualisation of information using small arrows, colour-coded stream and path lines and schlieren images. All these methods have their strengths and weaknesses. Above all, however, they are difficult to interpret without prior knowledge of the data being analysed. For this reason, a collaboration between delta h Ingenieurgesellschaft mbH and the Fraunhofer Institute for Industrial Mathematics (ITWM) in Kaiserslautern has resulted in the STRING software, which offers intuitive access to the results of flow simulations.
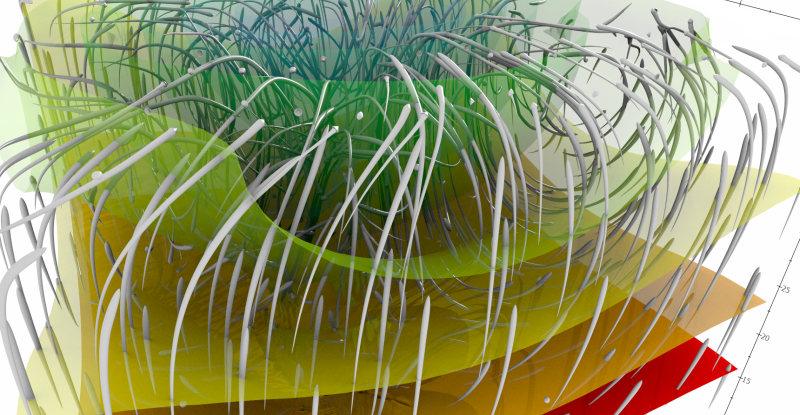
Visualization example
The programme makes it possible to visualise steady state and transient flows in two spatial dimensions as a video. The relevant direction and velocity information is represented by streamlets moving with the flow. A streamlet is a short line segment of a streamline. The direction of movement of a streamlet represents the direction of the flow and the length correlates with the velocity.
The software enables the import of flow data from SPRING and the saving of the individual calculated images for a video. These images can also be provided with a transparent background so that any additional data can be superimposed on the video in a subsequent work step. To make this easier, a world file is saved together with the individual images, which enables the video to be georeferenced in any geographic information system (GIS).
To generate a video, information on the geometry and velocities of the flow within this area is required from SPRING. For the initial distribution of the streamlets, a proven method is used that has long been applied at the ITWM as part of the Finite Poinset Method (FPM) developed there. The equations of motion of the streamlets are solved using an adaptive higher-order Runge-Kutta method. The error tolerance can be set as required. The Moving Least Squares method is used to interpolate the velocities from the data calculated in SPRING. Special cases in connection with complicated geometries are also taken into account.
During the animation, it can happen that very dense accumulations of streamlets form in depressions of the flow area or that all streamlets flow away from sources. In both cases, it is no longer possible to assess the prevailing flow in these areas. To avoid this, it is necessary to manage the local distribution of the streamlets. The ITWM can draw on many years of experience in the field of FPM to solve such problems. Various algorithms from this environment have been implemented in STRING.
The STRING programme can be controlled via a graphical user interface and the output of the individual images for the video can be freely adjusted. Parameters are given, for example, by the resolution and the running time of the finished video. The appearance of the individual streamlets can also be customised in great detail.
This provides clear impressions of the direction, course, speed and temporal development of the water flow. STRING unfolds its full potential in combination with SPRING 6.
 Results of the intermediate times of the transient flow calculation
Stand: 11.06.2025 | 