It is possible to visualise catchment areas taking into account advection and dispersion/diffusion processes. This means that local heterogeneities can also be modelled using the dispersion term, which cannot be determined using conventional velocity tracking methods, or only to a limited extent.
The basis of this approach is explained in more detail in Uffink, F., Application of Kolmogorov's backward equation in random walk simulations of groundwater contaminant transport; Contaminant Transport in Groundwater, Kobus & Kinzelbach, 1986 and Wilson, J.L. and J. Liu, Backward particle tracking to find the source of pollution in waste management. Waste Management: From Risk to Reduction, 1995.
If the concentration in a well is set to 1.0, probabilities of the particle entering the well are calculated as concentration values. A 95% probability of a particle entering the extraction well is calculated by displaying isoline concentration areas from 0.05 to 1.0.
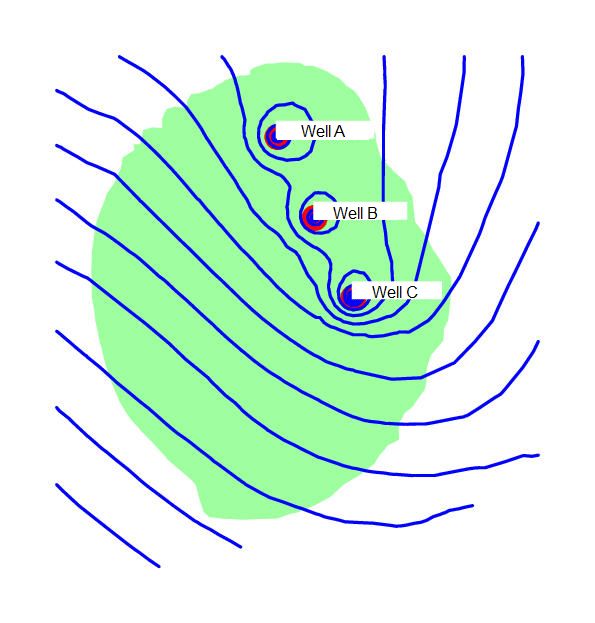
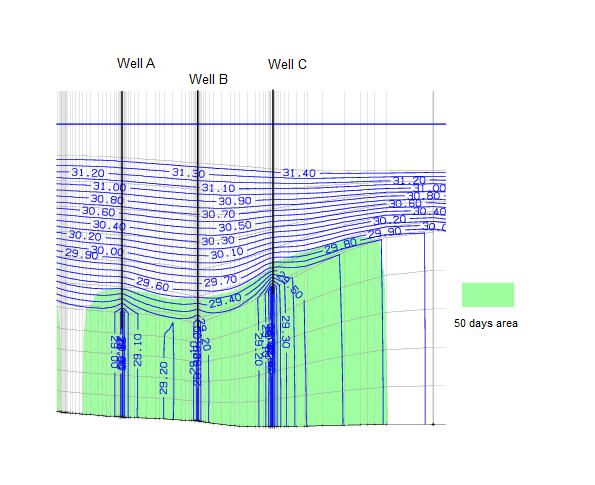
The images show a 3D example in which two aquifers are separated by a dam. The extraction wells pump from the lower aquifer. The 50 day area is shown in vertical and horizontal section:

Horizontal flow field

Vertical flow field
A detailed description of the procedure for an inverted flow is beyond the scope of this manual. On request, the calculation of transport processes with inverted flow can be discussed during a training course.
