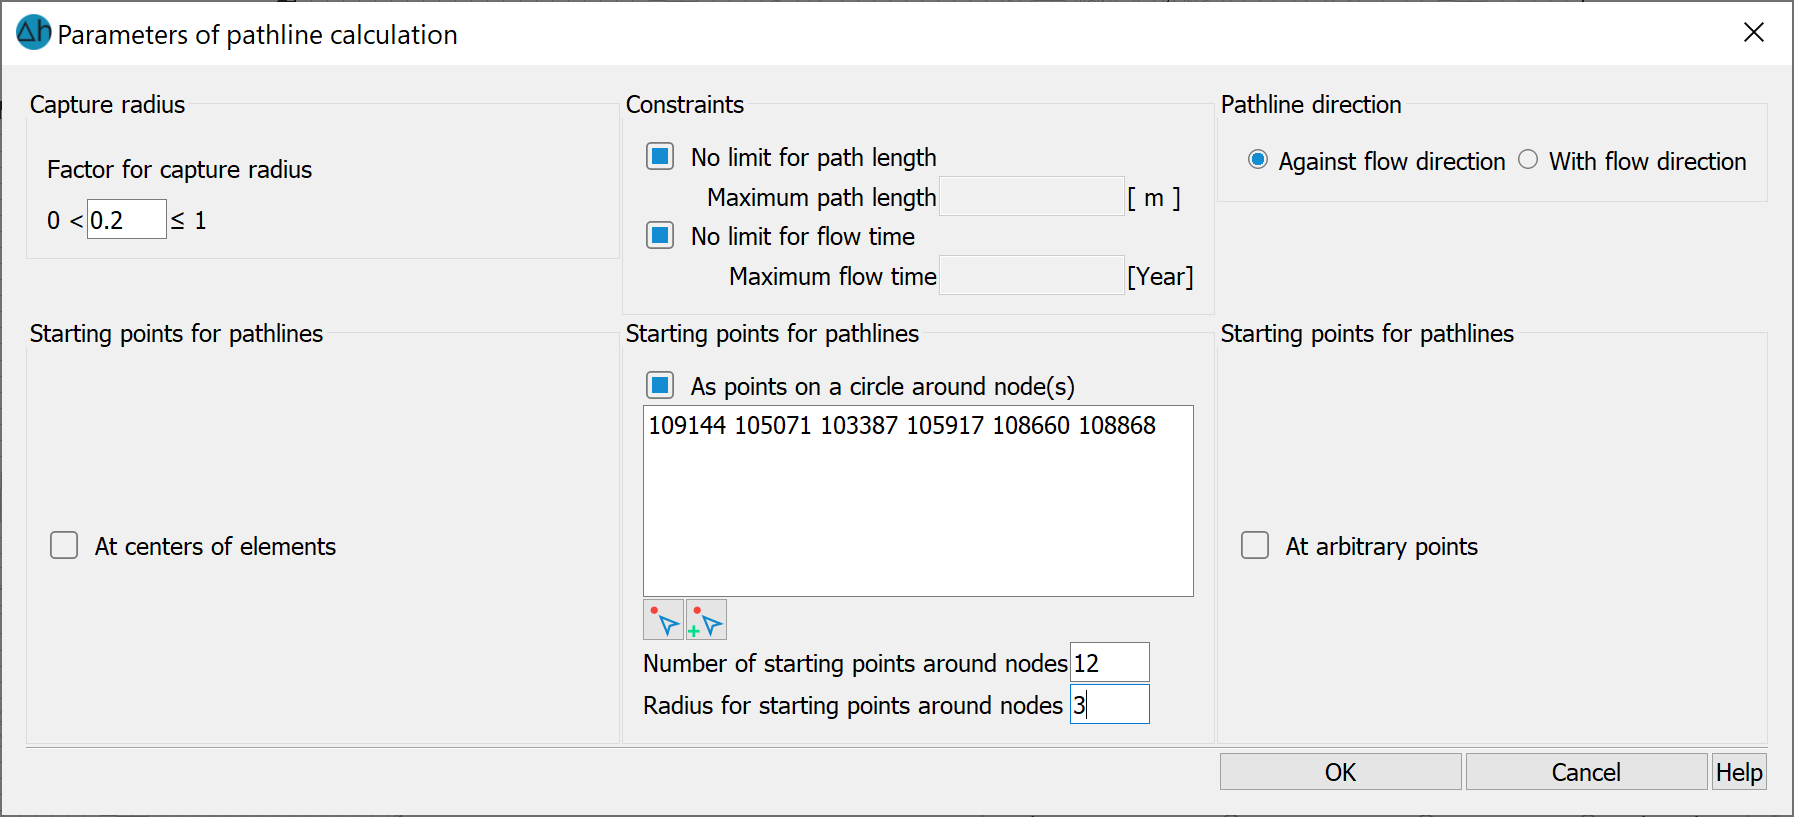
To display path lines, the path line calculation is taken into account in the flow calculation by activating the corresponding checkbox. The following window appears in which the criteria for the path lines are defined:
The input window for the INSTAT module differs in that there are no input options in the "Constraints" and "Direction" blocks.
The path line calculation is started in the SITRA module by activating the "Save extended velocity field for path line postprocessing" checkbox. The above input window then appears via the menu item File  Export
  Path lines... ".
In the steady stat flow calculation with the SITRA module, as with the GEONEU module, the path line calculation can be activated directly in the flow dialog, so that the above dialog box appears immediately.
The difference between the two methods is the following:
If the path line calculation is activated directly in the SITRA or GEONEU calculation module, the result data is saved for the plot display and can only be changed after a new flow calculation.
When calculating the path lines via the button "Save extended velocity field for path line postprocessing" it is possible to change the output of the path lines for the plot generation without the need for a new flow calculation (which can sometimes take a very long time).
Catch radius
When tracing a path line using the calculated velocities, a line will only run directly towards an abstraction well in exceptional cases. To avoid "wandering" around the node, a check is made at abstraction nodes to see whether a path line comes into the area of a well. If this is the case, the line is drawn to the node. Only lines that land in an element that has the corresponding well node as a corner node are trapped.
The catch radius is not actually a radius, but a scaling factor for the centre of gravity coordinates of the current path line particle in relation to the well node. The "snapping condition" is therefore dependent on the respective element size and is also influenced by the relative abstraction or injection rate weighted in the well. If the preset value does not provide satisfactory results, another value > 0 can be entered here.
Restrictions
A maximum distance (m) and/or a maximum flow time (in the respective time unit of the mesh file) can be specified as a cancellation criterion for path line tracking.
Path line directions
The path line direction can be selected against the direction of flow or in the direction of flow.
Starting points for pathlines
When you select the menu items "Starting points for path lines", the input windows open in which the
starting points can be defined. An interactive selection can be made in the user interface using the  button or
  button.
A combination of all three starting point types is possible. A porosity of 0.2 is taken into account in the path line calculation. This can be changed via the batch file of the flow calculation.
A typical application of the path line representation is the question of catchment areas of abstraction wells, e.g. which area in the vicinity of the well must be designated as a water protection zone (e.g. 50-day protection zone). For this purpose, it is advisable to visualise the area in the opposite direction to the flow direction.
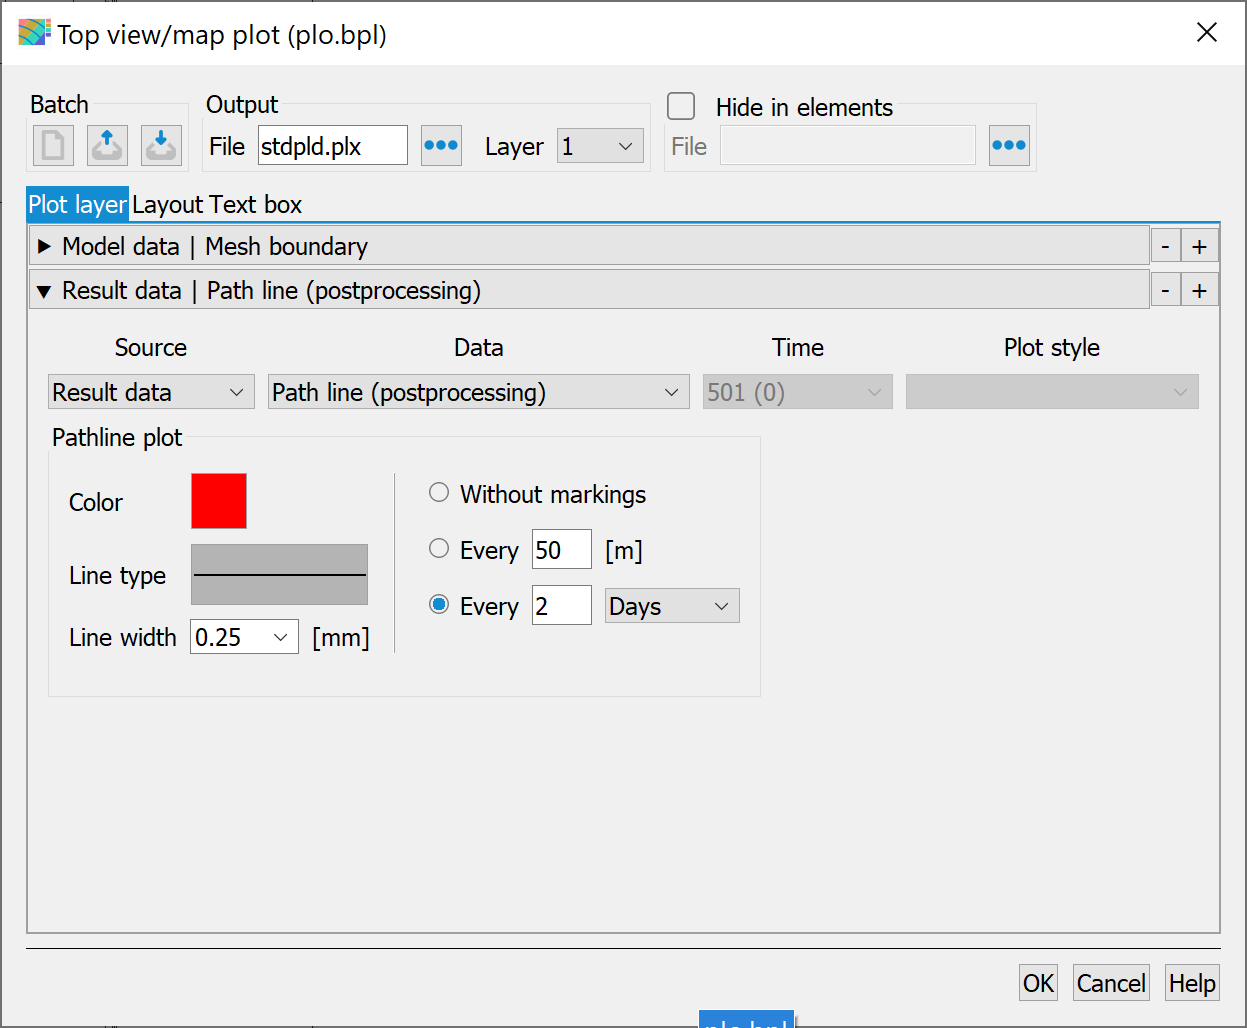
After the flow calculation, the plot must be created to display the path lines. To do this, select File  Create plot
  Top view/Map presentation…, specify Result data as the source, and select Path line as the Data in the input window. The following window opens:
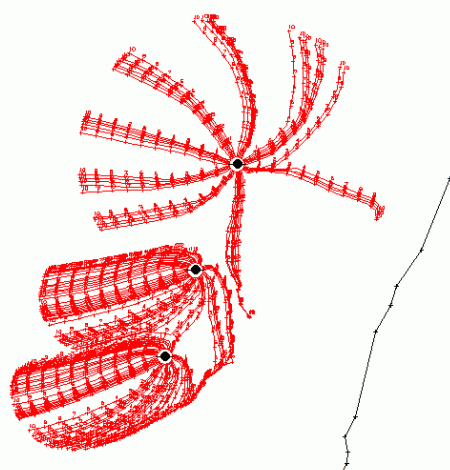
When selecting "Days", the specification "Markings after every = 50" means that a marking is placed on the route of the path line after every 50 days. To characterise the 50-day protection zone of a well, the corresponding 50-day isochrone can be constructed manually using the time markers. The parameters specified above and the node numbers of the wells (1, 2, 3) were used for the following image:

Path lines with a length of 500 m and one marking after every 50 days
This image shows the parameters set in the flow calculation. The path line ends after reaching the 500 m limit, the distance around the well corresponds to "the radius for starting points around nodes = 25 m", and there are 50 path lines.
However, it takes a little practice to obtain a meaningful image for your problem.
 Theoretical principles of streamlines


