A plot of hydrographs (batch command GANG) is possible only after a transient calculation.
After selecting the illustration type hydrograph the following input block appears:

Hydrograph nodes respective balance area
If you select the hydrograph nodes the numbers of the nodes or coordinates are specified of which hydrographs should be plotted. If coordinates are chosen, the hydrograph for the nearest node is created.
The selection of the balance area is possible if nodes or elements have been grouped to balance areas (attributes BILK, BILE). Volume hydrographs are then given for the balance area numbers.
The input is unformatted with any number of values per line. The individual numbers must be separated by a blank or a comma. There is the possibility of activating the button  , to capture the nodes in the main window of SPRING. If more nodes or coordinates should be captured, the button
  has to be selected.
In case of a3D model, only the nodes or elements of the top layer are captured. Node numbers of deeper layers are selected by adding the appropriate 3D offset.
Properties

Colour
The colour of the first hydrograph is determined.
The hydrographs can be represented in three different ways.

One picture per hydrograph curve
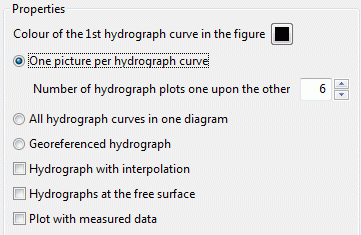
The specification defines how many individual hydrographs are presented in a column above each other in the resulting plot. For example, if there are 36 individual hydrographs and the number 9 is specified in this field there will be 4 columns with 9 hydrograph plots, one on top of the other.

All hydrograph curves in one diagram
Should the hydrographs be plotted all in one diagram after checking the box appears the following input block:
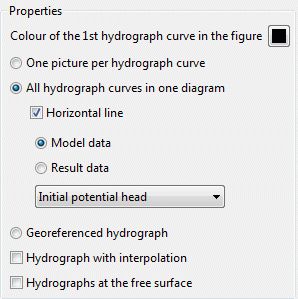
As a horizontal line, for example, a (steady state) initial potential value of the first selected node is shown. For this, the model data is activated and the type of data: initial potential heads is selected.
The selected colour is used for the first hydrograph. For the following hydrographs the next colour in the colour palette is used.

Georeferenced hydrographs
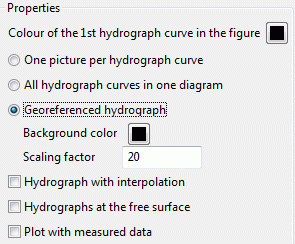
When this presentation is selected, at the selected nodes or elements are georeferenced hydrograph diagrams created. In addition, the background colour and a scaling factor can be specified. If “black” is chosen as background colour, the hydrograph gets a transparent background, if “white” is chosen as background colour, the hydrograph gets a solid background. The scaling factor affects the image size of the hydrograph diagram and should be no larger than 10.
Remark:
If a *.plx file that contains multiple georeferenced hydrograph curves is created this way, some processing steps have to be performed before the file can be overlaid. Each individual hydrograph is a separate *.plx map whose lower left corner corresponds to the position of the reference node (or the centre of the reference element) for which the hydrograph was created.
Such *.plx file can be transformed by the following procedure in a single map (in the SPRING mode plot file), then the *.plx file can be laid over a topographical map:

Via the menu item Map  Reduce
  To a single map all maps (= hydrograph curves) are reduced to one map. It does not matter which map is chosen as base.

Via the menu item Map  Edit
Edit  Adjust scale both scale factors are set to the one hundred-fold scaling factor of the input window.

Via the menu item Map  Edit
Edit  Scale
Scale  Scale with attributes, the map is scaled to the target scale, ie on the scale of the map, on which this file is overlaid later. Then the file must be saved.

The so manipulated hydrograph curves can then be laid over the target map (File  Import
  Overlay), that their left lower corner is georeferenced with respect to the target map.

Interpolation
The individual points of the hydrograph are connected either in linear fashion (deactivated button) or with the help of a spline-interpolation (activated button). The usage of the interpolation can cause over- and underestimations in the case of large value changes.

Hydrographs at the free surface
By activating this button the hydrographs of potential heads can be presented at the (upper) free surface instead of the selected layer (only 3D model).

Plot with measured data
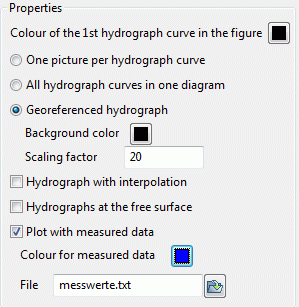
In the representation of the calculated curves measured nominal values (eg for a transient calibration) can be shown as additional hydrographs. The colour can be chosen freely.
The name of the file with nominal values can be entered manually or chosen from the file selection window. The format of the file is described in chapter: “File with hydrograph data“.
Range of values
For the formatted representation of the curves the ranges of the values between which the hydrograph should be displayed are defined.
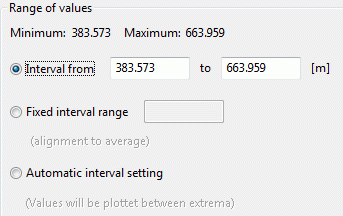

Interval from, to
Here it is possible to determine the exact upper and lower limits of the representation.
If some values of the selected hydrograph nodes exceed or fall below these limits the program changes these limits automatically.

Fixed interval range
It is possible to define a fixed interval, which is aligned at the mean value of the hydrograph.

Automatic interval setting

Setting an automatic interval, each hydrograph is accurately represented between its extremes.
