If the data should be shown over the time after a transient calculation it is possible to compare the calculated curves to the measured values (nominal values).
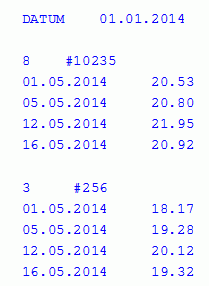
The measured data have to be present in the format of file with hydrograph data. The file has the following structure:

The file usually starts with a reference date. In the next line follows a node number.
The name of the measuring point can be assigned to the node number behind a hashtag, which is then shown in the plot.
In the following lines are then respectively the measurement date and the measured value (format f10.2) at this node (gauge or groundwater station). If all measured values of a node are listed, the file proceeds with the next node number and its measured values after a separating blank line.
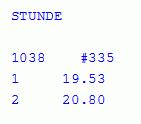
Instead of a date in the first line it is possible to define a time unit corresponding to the time unit of the transient input file (SECOND, MINUTE, HOUR, DAY, MONTH, YEAR). Then a time unit is defined for the measured values of the node instead of the date. Example:


 Heat re-injection