(Archive fl1.zip)
For a simulation of uncontrolled flooding processes it is necessary to mark the mesh nodes which represent the mine and to describe the correlation between mine water level and the water volume inside the mine. This correlation is called “h-V relation”. Uncontrolled flooding means that the draining of the mine will be stopped and the mine will begin to fill with groundwater until reaching the equilibrium.
The attribute for defining the nodes of the mine is called GRUB. You have to assign this boundary condition at node layer 6 and 7 with the help of the structure with the attribute GRUB.
The attribute GRUB contains the zone number of the mine. In this example the number is “1”. The corresponding h-V relation has to be defined in an ascii file which is called “grube1.hv” (file name = “grube”+zone number+”.hv”, see “fl1.zip”). The figure below shows the h-V relation of this example. For a better understanding during later simulation steps the gradient of the curve is displayed too.
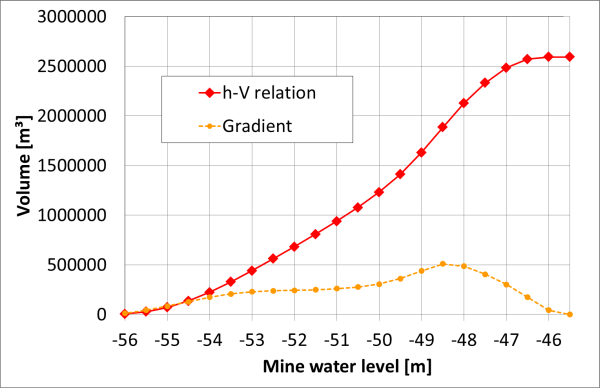
Relation between mine water level and flooded volume of the mine
For transient simulations in SPRING a file including the transient boundary conditions is always needed. In this example no transient boundary conditions were changed. Therefore the file is “empty” (see also trans.txt in “fl1.zip”).
File with transient boundary conditions (Flooding 1):
# SPRING tutorial
# Flooding
# Simulation 1
ZEITEINHEIT MENG JAHR
BEZUGSDATUM 01.01.2012
DATUM
02.01.2012
Before starting the simulation the definition of the initial values for the potential head of each node is needed. The necessary attribute is called EICH. Therefore import the results of the steady state flow computation (from directory fl0) using the item Attributes  Import Data/Computation Results:
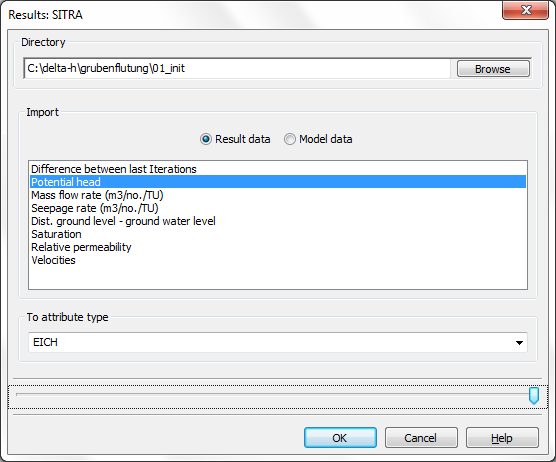
Setting initial potential heads
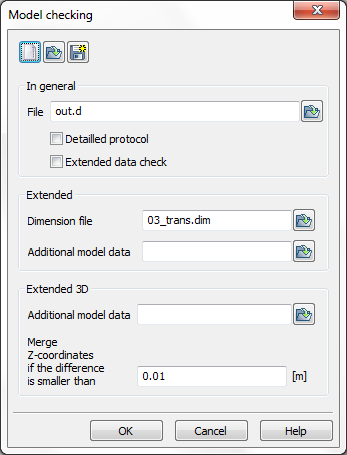
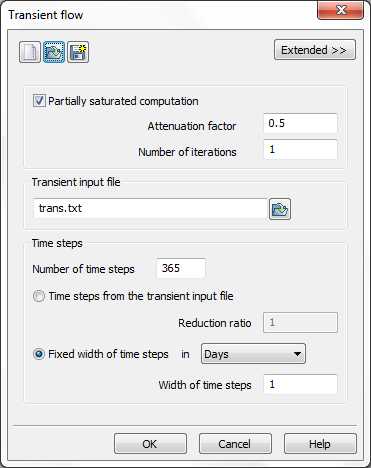
After setting the initial potential heads save the mesh and start the model checks with the item Calculation  Model checking. Continue with running the transient flow simulation with the item Calculation
  Transient flow:
|
|
|
Model checks (step 1) and transient flow parameters (step 2)
The resultant potential heads can be displayed by using the plot batch file “cs.bpl” for a vertical cross section and “pot56-7.bpl” for a horizontal cross section through layer 7 with the values of the 56th time step (see also figure below). The right figure also includes hydrographs of the resultant potential heads at selected nodes at the bottom of the mine. The dip in the curves is caused by reaching the end of the flooding process when the mine is filled completely with water. After this point the potential heads are rising up until reaching steady state conditions.
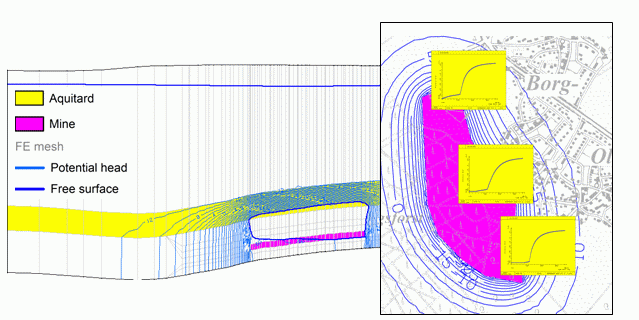
Vertical cross section (left) and horizontal cross section through layer 7 (right) with results 56 days after begin of flooding (Flooding 1)
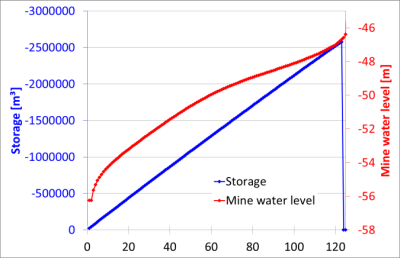
In addition to a standard transient computation simulating mine flooding creates a file called “gruben.csv”. This file contains a table with a complete balance for the flooding box for each time step. This allows you to display the resultant balance curves with the help of a spreadsheet. For this example the evaluation was done with MS Excel (see file “gruben1.xls” in “fl1.zip”) and is shown in the figures below.
The first figure presents the resultant mine water level and the ratios of the water balance depending on the several boundary conditions. For each time step the nodes which describe the mine were set to the boundary condition “seepage” or “potential head” depending on their current vertical position:

“Seepage”: The vertical position of the node (z-coordinate) is higher than the mine water level (unsaturated).

“Potential head”: The vertical position of the node (z-coordinate) is lower than the mine water level (saturated).
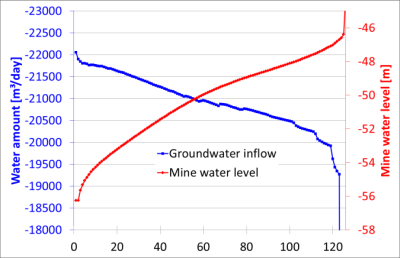
Both boundary conditions cause a mass flow rate respectively a mass flow which is exchanged between the mine and the aquifer. In the present example the sum of the mass flow from both boundary conditions is equivalent with the ground water inflow (see below).
The dip in the mass flow curves is caused by the gradient in the h-V relation. The mine water level reaches the top of the mine after 124 days.
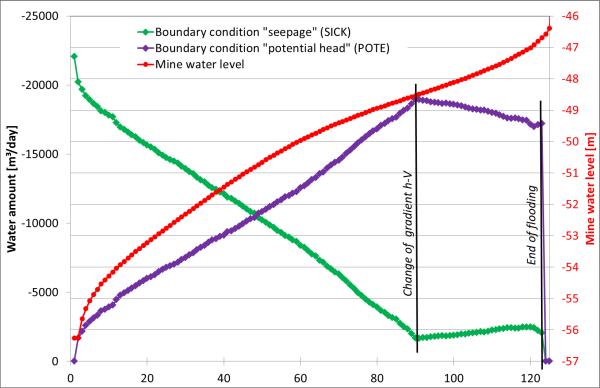
Water level and water amount until reaching end of flooding (Flooding 1)
|
|
|
Groundwater inflow (left) and storage (right) until reaching end of flooding (Flooding 1)
 Simulation 2: Controlled flooding

