(Archive fl2.zip)
In the second example the use of additional mine-specific transient boundary condition will be shown.
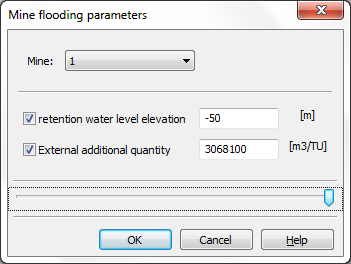
It is possible to define a retention water level elevation and external water supply for each mine. Both parameters can be changed in the transient input file. For external water supply a positive value has to be set if water should be pumped into the mine to make flooding faster. A negative value implies pumping water out of the mine. Both parameters can be initialized with dialog in Attributes  Special features
  Flooding parameters. Note: If you want to vary one of these parameters during a simulation an initialisation is needed here.

SPRING dialog for managing flooding parameters
To show the working of these flooding parameters the following transient boundary conditions were set:
Table 1: Transient boundary conditions (Flooding 2)
|
Date |
Time step |
Boundary condition |
Description |
|
01.01.2012 |
0 |
HMAX = -50 m MENG = 3068100 m³/year |
Begin of flooding up to mine water level -50 m with water supply of about 8400 m³/day |
|
01.03.2012 |
60 |
MENG = -13149000 m³/year |
Empty the mine by pumping 36000 m³/day (= 1500 m³/h) |
|
01.07.2012 |
182 |
HMAX = --46.5 m MENG = 5259600 m³/year |
Continue flooding up to mine water level -46.5 m with water supply of about 14400 m³/day |
|
01.09.2012 |
244 |
MENG = 0 m³/year |
Continue flooding without external water supply |
|
31.12.2012 |
365 |
|
End of simulation |
The file with the transient boundary conditions can be found in “fl2.zip” and looks as follows.
File with transient boundary conditions (Flooding 2):
# SPRING tutorial
# Flooding
# Simulation 2
ZEITEINHEIT MENG JAHR
BEZUGSDATUM 01.01.2012
DATUM
01.03.2012
MENG #empty mine with pumping rate 1500 m3/hour
1-13149000.
DATUM
01.07.2012
HMAX #restart flooding upto mine water level -46.5m
1 -46.5
MENG #add about 600 m3/hour
1 5259600.
DATUM
01.09.2012
MENG #continue flooding without water supply
1 0.5
The control of the simulation follows the steps of the example above.
The results of the present simulation are shown in the figures below. They base on the evaluation of the file “gruben.csv” and are included in the file “gruben2.xls” (“fl2.zip”).
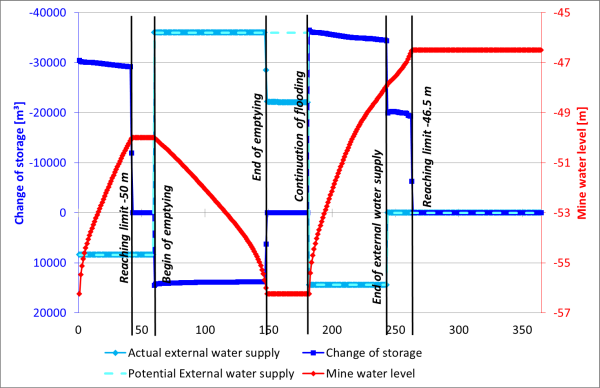
The given transient boundary condition for the water supply is shown by the curve “potential external water supply” (identical to definition of attribute MENG). The curve named “actual external water supply” shows the water volume which can be pumped in or out of the mine in a compatible way with the physics of the given system. E.g. the actual and potential water supply differs between reaching the end of emptying of the mine and continuing of the flooding. This is caused by the defined water supply (MENG = 36000 m³/day) which is not available after emptying the mine. Therefore the actual pumping rate after emptying the mine will be lower (about 22.000 m³/day).

Mine water level, change of storage and external water supply (Flooding 2)

Boundary condition dependent mass flow rates (Flooding 2)
