The calculation of stream lines is possible only after a two-dimensional horizontal flow calculation (steady state or transient). To illustrate the stream lines (= quantity-based path lines) they have to be exported: File  Export
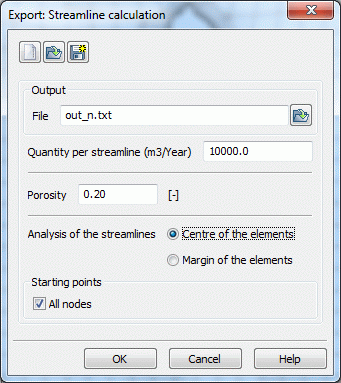
  Stream lines. You will get this input window:

Stream line calculation
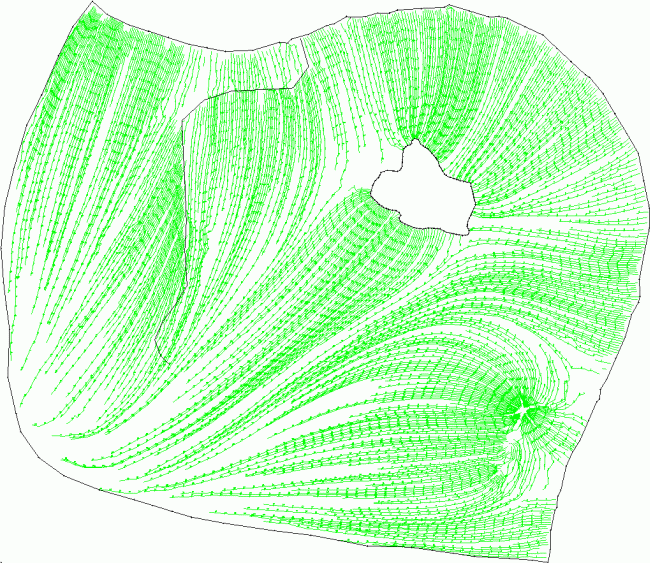
The declaration of the "quantity per streamline (m³/year)" requires a bit of sensitivity for the available water quantities in the model. The example is calculated with 10,000 cubic meters per year, and there are stream lines run in all nodes (specifying individual node numbers is allowed only at withdrawal wells). After the data export the result data “path lines” can be selected in the plot generation. The input window is the same as for the path lines and requires the same parameters. Here, "Set marks after every 100 m", the result is the following picture:

Quantity of streamlines: 10.000 m³/year
Streamlines close together mean large quantities of water, in areas with sporadic stream lines flows only few water. Sharp bends in the flow curve are an indication of leaps in the K-values of the adjacent elements.
 Determining a catchment area with Schlieren (FLIC)
