Often the question of the catchment areas of water courses or wells arises, e.g. in the determination of drinking water protection zones or the influence area of a withdrawal well.
The program FLIC (Konrad-Zuse-Centre for Information Technology Berlin) can visualize the velocities computed in a flow calculation by the help of Schlieren. This visualization provides a much better image of flow paths than the velocity arrows used in the plot generation. This is especially important for transient and 3D models where a streamline calculation is not possible
In the example model, there are two catchment areas of wells, which can be distinguished by the presentation of Schlieren clearly from each other. The procedure for presenting the Schlieren is this:
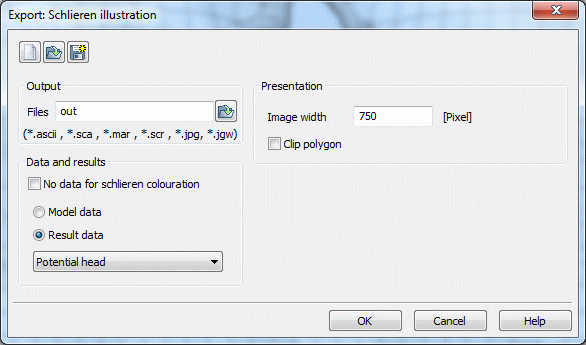
After a successful flow calculation, the data has to be exported via File  Export
 Schlieren illustration. The following input window appears:

Input for the Schlieren illustration
The output files are called "out.*" by default, the name can be changed by the user. Attached are the six output extensions .ascii, .sca, .mar, .scr, .jpg and .jwg.
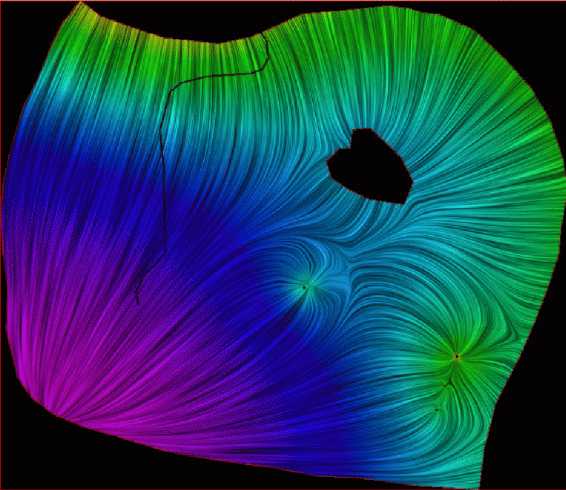
The presentation of the Schlieren is done in the format. ".jpg" with the necessary geo-referencing file ".jwg", which allows a faithful representation of coordinates. The colour of the Schlieren can be changed by selecting a type of data (model or result data). In the example, the potential heads were chosen as a colour sensor. The following picture results:

Schlieren illustration of the potential heads
The image is called via File  Import File
  Overlay file: *.jpg. You can see clearly that the course of the Schlieren corresponds to the course of the path and stream lines. The other files can also be used in other geographic information systems (e.g. ARC INFO).
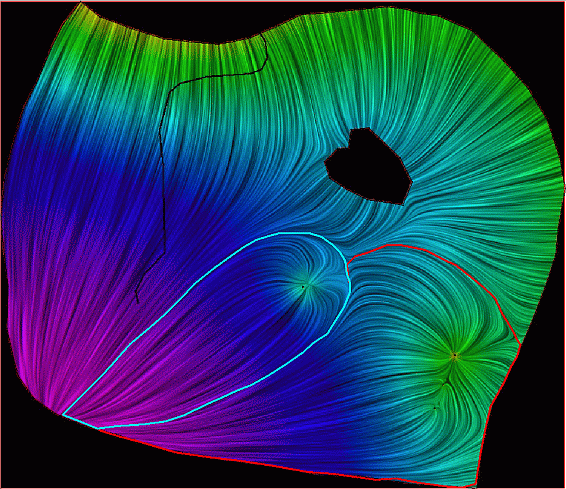
By using the structure menu of SPRING the catchment areas of the (line of -) wells can be digitized along the course of the Schlieren and saved as area structure.

Digitized edges of the catchment areas of the well (cyan) and the line of wells (red)
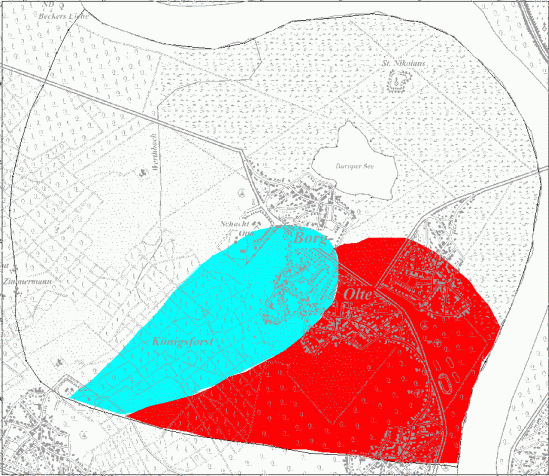
After deleting the Schlieren representation and overlaying the topographic map the catchment areas are referred to their geographical site. Eventually you have to change the display of the structures from a polygon into a filled area.

Catchment areas of the wells
 Geo referencing of Schlieren illustrations
