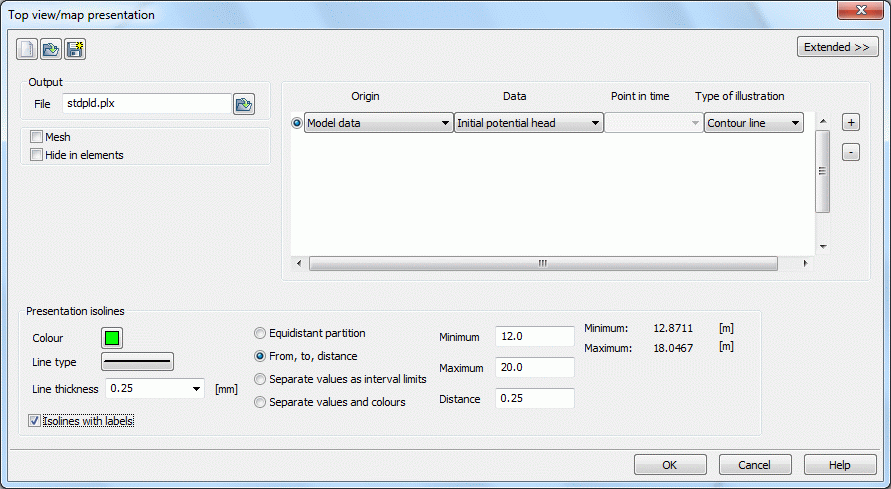
Following the model inspection, plots can already be generated from the model data. To illustrate the previous model version, the calibration potentials (EICH) can be displayed in an isoline diagram. Upon clicking on File  Plot generation
  Top view/Map generation, the following input window appears:

Plot generation
After selecting the data type Model data  Initial potential heads (EICH)
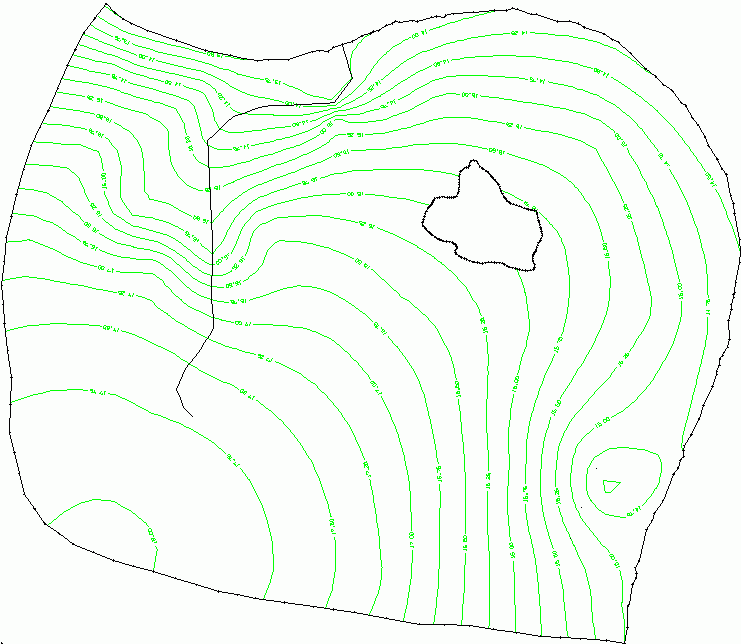
  Contour lines, the display From to at a distance: 12.0 - 20.0, 0.25 m, Colour: green is selected. Then a name is entered for the plot ("eich_intpol.plx"), and the calculation run is started. To view the plot, press File
  Open: *.plx. The following picture appears:

Contour lines of the interpolated initial potential heads
The next step is Calibration by the gradient method 
