If there is a watercourse in the study area that is represented by the VORF and LERA (or LEKN) attributes, the control lines can be used to create a mass balance in the vicinity of the watercourse. To do this, the area around the body of water is refined once or twice. Control lines are then created roughly parallel to the course of the watercourse on both sides.
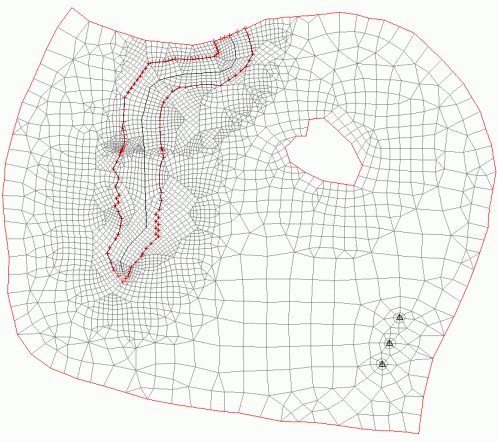
In the following example, the control volume is formed by the two lateral control lines in the west and east, by the main receiving watercourse in the north and an imaginary connection of the control lines in the south. The mass balance must result in identical inflows and outflows in the steady state.
The following rates must be determined:
Inflow (+) and outflow (-) via the control lines into the control volume (via KONT)
Groundwater recharge in the control volume (via FLAE)
Leakage rate of the watercourse (via leakage coefficients)
Outflow via the fixed potential heads in the mouth area (via mass flow rates)
Creating the control lines
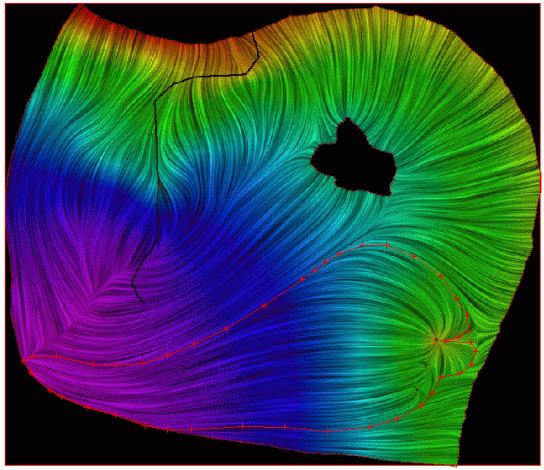
The amount of water determined in the control line calculation corresponds to the groundwater-based inflow and outflow of the watercourse. The Schlieren image in the example shows that the watercourse has only a very small connection, as the streaks mainly flow parallel to the watercourse and not towards it.

Schlieren image of the example model
The control lines are generated with Attributes  Assign
  Direct and selecting the data type "KONT". After the flow calculation, the rates flowing over each element edge as well as the total rate of a control line can be read in the output file out.* (Extension depends on the flow calculation module).
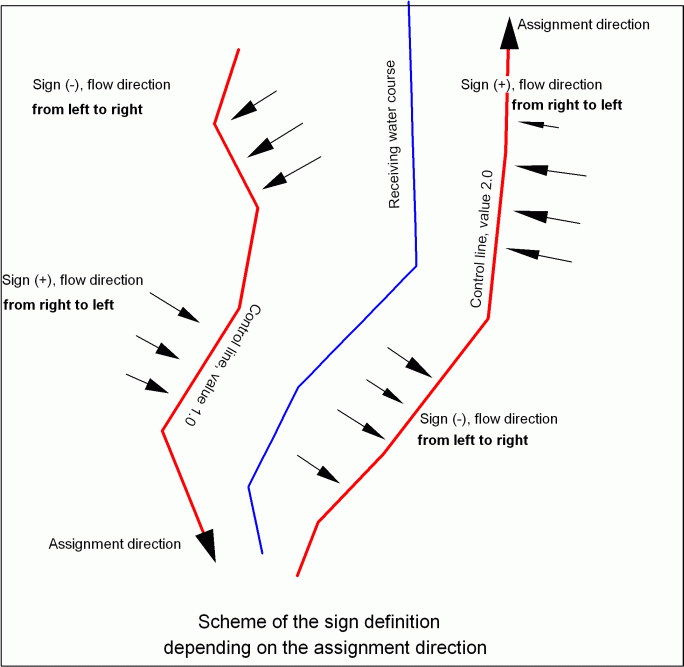
The signs of the specified rates can best be read in a plot of the control line calculation, as they depend on the assignment sequence: If you look IN the direction of assignment, the flow from right to left is positive.

Diagram of the flow direction depending on the assignment direction

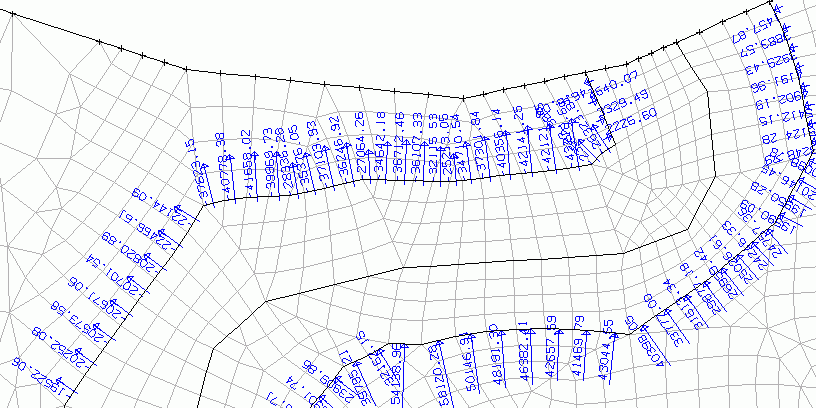
Position of the control lines and quantities (detail)
On the eastern side there is an inflow (+) into the control volume, and on the western side there is an outflow (-) from the control volume.
As the total rates of both control lines are positive, the value of the western line must be recognised as an outflow and therefore negative in the mass balance. After a steady state calculation with the SITRA module (partial saturation, 5 iterations), the value of the western line is (-) 740284 m³/year and the rate of the eastern line is (+) 808193 m³/year.
Groundwater recharge calculation
After creating the control lines to the left and right of the watercourse, an area structure (Structure  New
New  Area) that covers the entire control volume is created. The size of the selected area is displayed in the status bar of the SPRING interface with View
  Calculate area (or the corresponding button
  ). In the example, it is approx. 1975284 m². This value is calculated with by multiplying the area by a recharge rate of 0.200 m³/m²/year, which results in a recharge volume of approx. 395057 m³/year.

Area structure for the groundwater recharge calculation
Determination of leakage rates
The BILK attribute is assigned to the watercourse nodes to determine the leakage rate of the watercourse. The leakage rate is then specified in the output file in the mass balance: it is -209405 m³/year.
Determination of mass flow rates
As the watercourse under consideration flows into a main receiving watercourse with fixed potential heads, the outflow via the fixed potential head boundary condition in the control volume must also be taken into account. The rates are imported into SPRING via Attributes  Import model data/result data...
  Mass flow rate
  to KKKK. The mass flow rates of the nodes in the control volume are added up via Attributes
  Compute
  Sum attributes.... The mass flow rates of the left and right "edge nodes" of the control area are averaged and only added once, as they each cover half the mass flow rate of the neighbouring elements. This results in a mass flow volume of -260292 m³/year.
Once all values have been determined, the mass balance for the control volume [m³/year] can be drawn up
|
395057 |
+ 808193 |
- 740284 |
- 209405 |
- 260292 |
= |
-6731 [m³/year] |
|
Groundwater recharge |
Inflow |
Outflow |
Leakage rate |
Mass flow rate |
=! |
0 |
The deviation of -6731 m³ corresponds to 0.6 % of the negative water volumes.
Such a balance test can be used to check the position of control lines. The accuracy of a control line depends significantly on the discretisation and the direction of flow: the more vertical the flow, the more accurate the rate derived from the velocity (Q = V * K * I).
 Volume of water flowing through a lake (GLEI)
