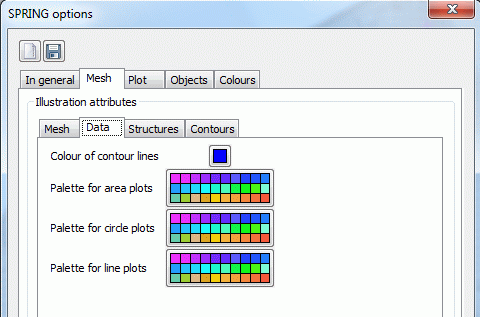
For the representation of data the options shown in the following input window are available:


Colour of contour lines (variable XSUSIIsolPen)

Colour for area plots (variable XSUSIFlaePen)

Colour for circle plots (variable XSUSIKreiPen)

Colour for line plots (variable XSUSILinePen)
The chosen colour palettes are used for representing contour lines or area -, circle or line plots in the menu View  Show attributes.
