The following input window appears:

Output
Here the name of the output file is determined to which the specific extensions are attached.
|
File |
Contents |
|
<name>.ascii |
This file contains the for FLIC necessary information about the velocities at the nodes and element centres in a 2D model or a horizontal section through a 3D model. It also contains the incidence of the triangle mesh (SPRING-squares are subdivided in 4 triangles, SPRING-triangles are subdivided in 3 triangles) used in FLIC. In a vertical section the file contains the for FLIC necessary information about the velocities at the grid points. |
|
<name>.sca |
This file is only created when scalar data are selected for colouring the Schlieren. It contains the necessary data at the nodes and element centres in a 2D model or a horizontal section through a 3D model, supplemented by the triangle incidence used in FLIC. In a vertical section through a 3D model, the file contains the values of the data at the grid points. |
|
<name>.mar |
This file is only created when markings are present (though not in a vertical section through a 3D model). Markers are realized here as "asterisk". If these markers are not desired, the corresponding part in the file (after the comment "point markers") has to be deleted. |
|
<name>.scr |
This file is used as a command file for FLIC (called: "flic cmd = <output_file> scr"). The filename of the bitmap generated with FLIC is preset to <output_file>.jpg (command line "out =..."). Alternatively, a pgm-format is available by changing the suffix to .pgm. If markings were issued as an overlay file, the file is overlaid with the command "overlay =...". If scalar data were output on the grid, these are used for colouring using the command "colorfield =...". The extreme values of the scalar data in the command "colorrange =..." play a crucial role in colouring. The used colour palette can be shifted by modifying these extreme values. If no scalar data are used for colouring, the velocities are crucial for the colouring ("colorfield =mag"). Here are also the extreme velocities essential for the colouring in the command "colorrange =...".
|
|
<name>.jpg |
Image file |
|
<name>.jgw |
To the image file corresponding georeferencing file |
Data and results
The default setting is displaying the velocities. Only by unchecking the box data for the colouring of the Schlieren can be optionally selected.
By selecting the model or result data appears a submenu in which the data types are listed, which have values at all nodes or elements. If there are transient result data the point of time must additionally be selected.
Presentation

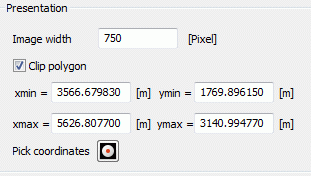
Image width in pixel
The horizontal resolution of the Schlieren image can be specified in pixels. The resulting vertical resolution is determined in the calculation and passed on to FLIC. Thus, unintended distortions in particular during the clipping are prevented. The default size of the bitmap generated with FLIC amounts to 750 pixels in x-direction for 2D models or horizontal sections through 3D models and is rounded in the y-direction according to the model size. In vertical sections, the default size is based on the defined grid (10 times the number of grid points) (command line "size = x... ").
Clip polygon
At this point, a rectangle can be defined, in which the Schlieren image is displayed.
By activating the button Pick coordinates  the points are captured interactively in the SPRING-surface.
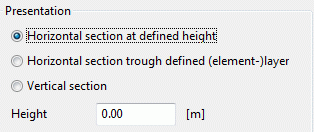
For 3D models has to be selected additionally whether a horizontal or vertical section should be exported as presentation.
The position of the horizontal section can be defined in two ways:


Horizontal section in a defined height:

Horizontal section through a defined (element-) layer:
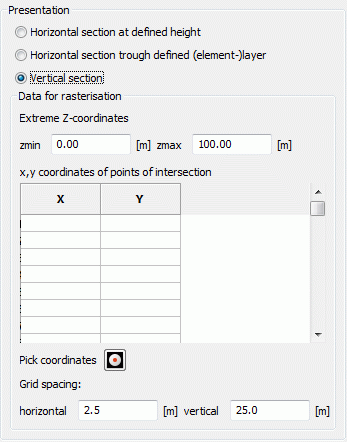
The vertical section of the Schlieren illustration is not performed on the basis of the original mesh, but on a grid of the cut surface. The Schlieren are presented based on the calculated velocities at the grid points. The finer the grid is, the better is the colour representation. However, the reduction of the grid width under the existing FE mesh element size improves the representation only up to a certain point, after that only the computational cost increases. To define the position of the vertical section and the grid the following input is required:

Data for rasterisation

Extreme Z-coordinates:
The minimum and maximum height as the bottom and topmost boundaries of the vertical section (zmin and zmax) are required.

Location of the vertical section in the horizontal:
The location of the vertical section is defined by a minimum of two points in the horizontal plane.
At least two points are indicated in the horizontal plane to determine the section. This can be done manually by entering the coordinates or interactively in the SPRING-surface ("pick coordinates"  ).
).

Definition of the grid distances:
The grid spacing is determined by the input of the grid sizes in the horizontal and vertical directions.
During the calculation the velocity vector and eventually the value of the 'scalar' data are calculated at all coordinates (x, y, (z)) defined by the grid spacing and grid edges.
The buttons at the top of the input window allow resetting the input parameters ( ), opening an existing batch file (
 ) or saving the current batch file under another name (
 ).
).
 Batch file for the Schlieren illustration
