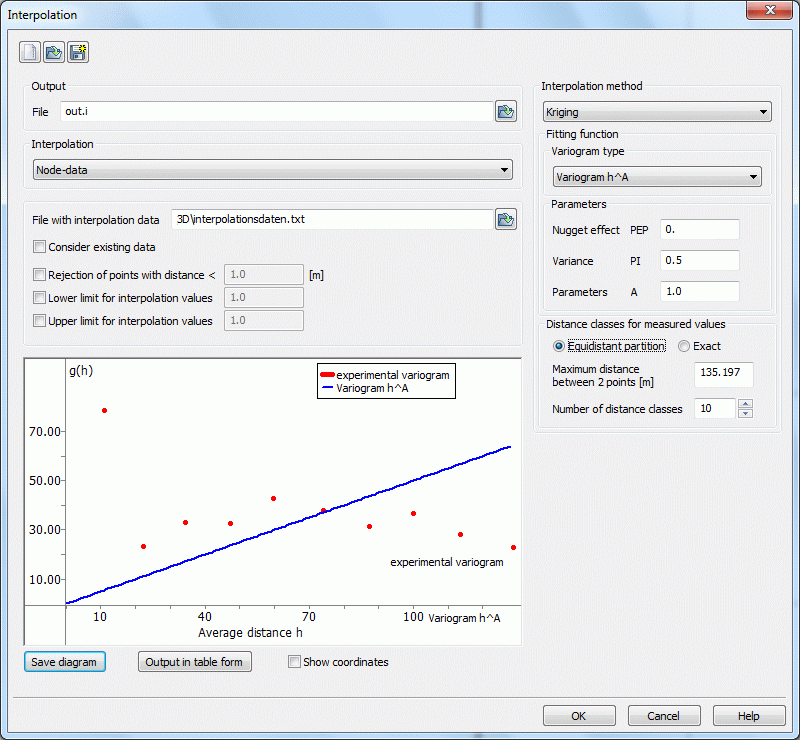
When you call the Kriging interpolation the file selection window appears first. There you have to select the file with the variogram data if not already an interpolation file has been selected before. This file has to be in the Format of the structure data file (ASCII) . Then the following dialog box appears:

The user can choose from the 6 possible variograms, which are described above.
Depending on the chosen type, different parameters are required:
In case of types from (1) to (5), the user must define the parameters PEP, PI and A.
Type (6) requires the degree of the fitting polynomial form and the number of points in the experimental variogram where the polynomial is approximated. The parameters are described in detail above .
To create the experimental variogram, it is necessary to define the number of distance classes and the partition of the classes. The button equidistant partition causes a uniform partition. In the resulting dialog box, the number of classes and the maximum distance can be chosen. Using the button exact the upper and lower boundary of each class can be determined individually (in another dialog box).
Choosing the individual input after the uniform distances makes it possible to edit the values from the uniform partition. If the user changes the settings from uniform to individual partition, the distance from the last class represents the maximum uniform distance. The number of classes corresponds to this value.
Here appears the variogram based on the chosen input data. The user is able to define a fitting shape function interactive.
By using the button „Save diagram“ the variogram is saved as an image file (*.bmp, *.jpg, *.png). By activating „Output in table form“ the data is saved in a table. By activating the check box „Show coordinates“ and moving the mouse inside the diagram the coordinates of the interpolation data are shown.
Remark:
The Kriging algorithm is not suitable for large numbers of measured values. Even for the variogram, the computing time and required memory space increase with the square of the number of measured values. The real interpolation computing time for an LU factorization of the weighting matrix is proportional to n³. Each variogram requires many calculations for each pair of measuring points. Therefore, interactive parameter determination and variogram computing require much time without really carrying out the Kriging interpolation.
 Interpolation of a Groundwater Contour Map
