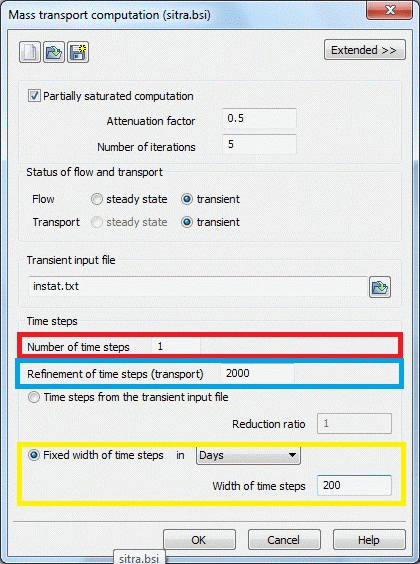
After the model checking follows the calculation of the mass transport. The following input window appears:

Transient parameters (3D)
Explanation of the time steps
Red marking: The number of time steps, here 1, determines the duration of the transport calculation. Duration = number of time steps * time step width (here: 200 days).
Blue marking: Time step refinement, will indicate the subdivision of the time step size in time steps of the transport calculation (here: 200 days/ 2000 = 1/10 day).
Yellow marking: The time step width defines the duration of one time step of the flow calculation.
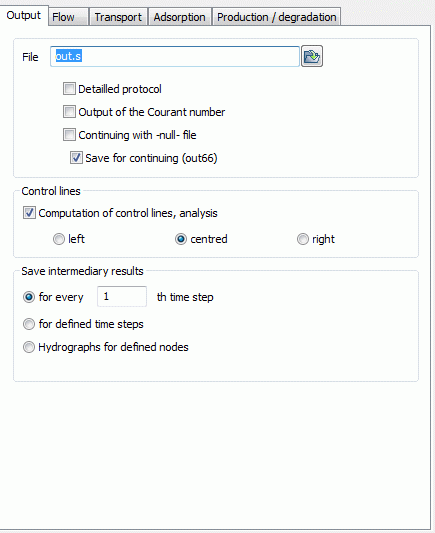
The quantity-based results are stored to the same time steps in which the potentials are saved in the background files (“Extended”  Output):

Output parameters
After completion of the model checking, flow calculation and plot generation you obtain the following concentration distribution after 200 days:

Concentration distribution after 200 days, isolines in an interval 5 to 50 mg/m³ with a distance of 5 mg/m³
