A calculation of the seepage surface in a dam needs precise discretization. Inside the dam is a permeability which is about tenfold lower than the permeability of the outer material. This leads to oscillation problems in the flow calculation, if the element size is not adjusted stepwise.
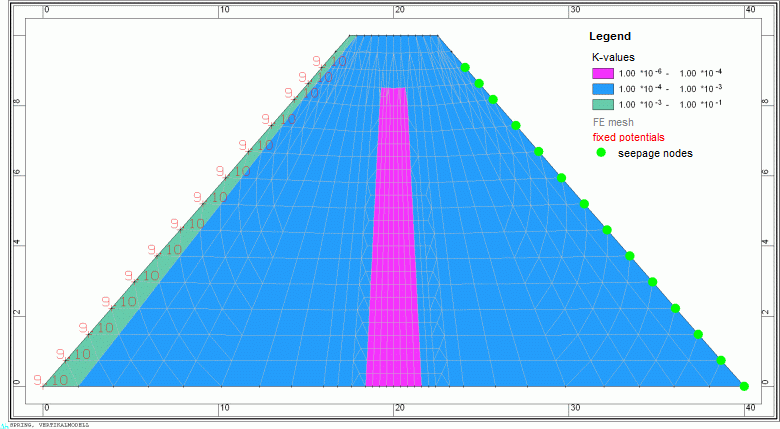
The following figure shows the essential model data for a dam:

Model data of a dam (double superelevation in y-direction)
These are the necessary parameters for a flow calculation:

POTE: fixed potential heads at the boundary nodes of the water side in m NN (altitude of the water level)

KWER: green = 0.001 m/s, blue = 0.0001 m/s, pink = 0.000001 m/s

MAEC: horizontal expansion (user defined)

SICK: at the land side boundary nodes up to the altitude of the water level (value = 0.0)
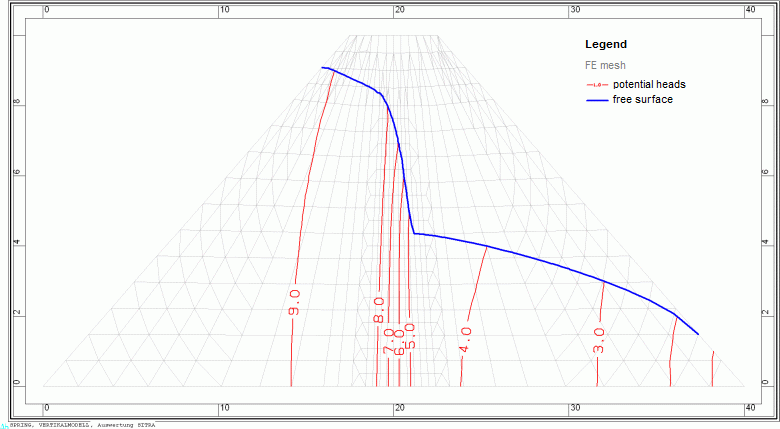
After a steady state flow computation (10 iterations) you get the following figure:

Result data potential heads and seepage surface of the dam
The location of the seepage surface (blue) corresponds to the calculated zone of the free surface.
Where the seepage line intersects the land side of the dam water percolates to the surface. In figure 6 you can see it at three nodes at the right bottom of the dam. In SPRING you can assign the percolation rate to any attribute with Attributes  Import result data, selecting the background file "aaa" and selecting "Seepage rate [m³/no./TU]", e.g. to "KKKK". With View
  Show attributes you can then visualize the chosen attribute and with Attributes
  Edit nodes all node attributes are listed, including the seepage rate. The total quantity of the seepage rate has to be calculated per running dam-meter.
